Hello! Welcome to the next lesson in our module on monitoring and troubleshooting distributed applications.
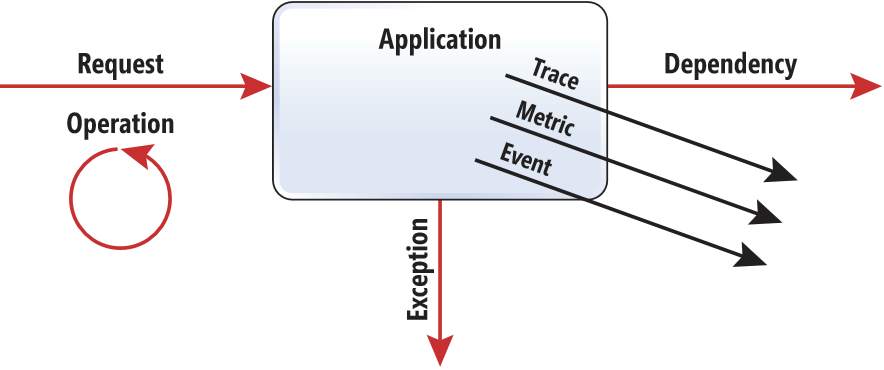
In our previous session, you successfully enabled Application Insights for a .NET web application. You now have a steady stream of default telemetry, including requests, dependencies, and exceptions, which you can visualize in the Live Metrics stream and Application Map.
Today, we move from the automatic to the intentional. Your goal is to learn how to track custom events and metrics from an application using the Application Insights SDK. While the default telemetry tells you how your application is running, custom telemetry tells you what your application is doing from a business or logic perspective. This is crucial for answering questions like "How many users completed a purchase?" or "What is the average processing time of our core algorithm?".
Given your strong C# and .NET background, you will find the implementation straightforward. We will focus on the specific APIs and the conceptual difference between events and metrics.
1. Custom Events vs. Custom Metrics
Before we write any code, it's vital to understand the distinction between custom events and custom metrics. They serve different purposes and are stored and optimized differently within Application Insights.
How to Track Custom Events and Metrics in Azure Application Insights
This article from the OneUptime blog provides a clear and concise distinction between custom events and custom metrics.
Read the section titled 'Custom Events vs Custom Metrics'. Pay close attention to the examples provided for each and where they are stored (customEvents vs. customMetrics tables).
To summarize the key difference:
- Custom Events: Represent discrete occurrences. Use them to count things that happen, like a user clicking a button, a file being generated, or a specific business rule being triggered.
- Custom Metrics: Represent numeric measurements over time. Use them to track values you want to aggregate, such as averages, sums, or percentiles. Examples include shopping cart totals, queue lengths, or calculation durations.
2. The TelemetryClient: Your Gateway to Custom Telemetry
The primary tool for sending custom telemetry from your .NET application is the TelemetryClient class, which is part of the Application Insights SDK.
In modern ASP.NET Core applications, the best practice is to get an instance of TelemetryClient via dependency injection (DI). Since you've already configured Application Insights in your project (either via AddApplicationInsightsTelemetry() or UseAzureMonitor()), the DI container knows how to create and provide this object for you.
You simply request it in the constructor of your controller or service:
private readonly TelemetryClient _telemetryClient;

public MyController(TelemetryClient telemetryClient)
{
    _telemetryClient = telemetryClient;
}
The video below explains this process.
Custom Events and Metrics :: Application Insights (5 of 6)
This short clip from Kevin Griffin's series on Application Insights explains the role of TelemetryClient and how to obtain it using dependency injection.
Watch from 03:15 to 04:16. The key takeaway is that you should use the single, managed instance of TelemetryClient provided by the DI container.
3. Tracking Custom Events
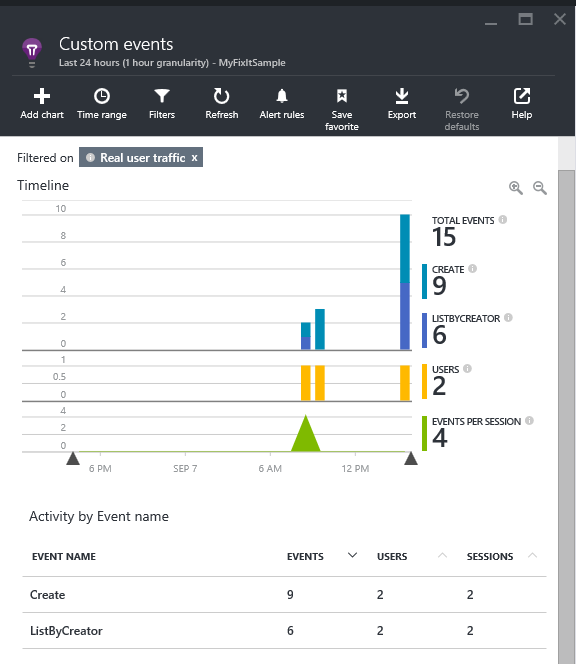
With your TelemetryClient instance, you can now track custom events using the TrackEvent method.
A custom event can include:
- Event Name (required): A string that identifies the event (e.g., "ItemAddedToCart").
- Properties (optional): A
Dictionary<string, string>for adding contextual, filterable information. These are stored in thecustomDimensionsfield. - Metrics (optional): A
Dictionary<string, double>for attaching numeric measurements to the event. These are stored in thecustomMeasurementsfield.
The following video demonstrates tracking a simple event and then enhancing it with custom properties.
Custom Events and Metrics :: Application Insights (5 of 6)
Watch this detailed demonstration of implementing TrackEvent. It shows the entire process from injecting the client to viewing the event in the Azure portal.
Watch from 02:17 to 03:15 to see the TrackEvent method signature, and then watch the full demo from 04:16 to 10:43. Pay attention to how a simple event is first tracked, and then how a Dictionary is used to add rich metadata, which then appears in Live Metrics and Log Analytics.
OpenTelemetry Equivalent
If you are using the modern OpenTelemetry setup, you can still track custom events. The OTel-native way is to use the standard ILogger interface and add a special attribute to your log message.
// Using ILogger to send a custom event with OpenTelemetry
logger.LogInformation(
    "Item checked out. {ProductId} {UserId}",
    "PROD-123", "USER-456",
    extra: new Dictionary<string, object>
    {
        // This special attribute tells the Azure Monitor exporter to create a custom event
        ["microsoft.custom_event.name"] = "CheckoutComplete"
    }
);
You can find more examples of this in the "Send custom events" section of the Microsoft Learn document titled Add and Modify OpenTelemetry in Application Insights.
4. Tracking Custom Metrics
While you can attach numeric values to custom events, if your primary goal is to aggregate a number over time (e.g., find the average queue size), you should use custom metrics. They are more efficiently processed and stored for this purpose.
The Application Insights SDK provides two main ways to do this:
TrackMetric(): A simple method to send a single metric value.GetMetric().TrackValue(): The preferred, more advanced API. It pre-aggregates metrics on your application before sending them in batches, which is more efficient and cost-effective, especially for high-frequency metrics. It also supports creating multi-dimensional metrics.
The following video provides an excellent walkthrough of tracking both single-dimensional and multi-dimensional metrics and visualizing them in the Azure portal.
Custom Events and Metrics :: Application Insights (5 of 6)
This final segment from the video series covers custom metrics in depth.
Watch from 10:43 to 20:00. This is a crucial section that covers: The definition of a custom metric (10:43). The concept of single vs. multi-dimensional metrics (12:05). The importance of pre-aggregation (14:10). A demo of tracking a single-dimensional metric (average delay) and viewing it in the portal (14:34). A demo of tracking a multi-dimensional metric (API hits by state/city) and using splitting/filtering in the portal (20:00).
OpenTelemetry Equivalent
With OpenTelemetry, you use the System.Diagnostics.Metrics.Meter API, which is the .NET standard. You create instruments like Counter or Histogram, and the Azure Monitor exporter automatically maps them to custom metrics in Application Insights.
// OTel: Define a meter and a counter instrument
var meter = new Meter("MyApplication.BusinessMetrics");
var itemsSoldCounter = meter.CreateCounter<int>("items-sold");

// Later in the code, increment the counter with dimensions
itemsSoldCounter.Add(1, new KeyValuePair<string, object>("item_category", "electronics"));
You can review detailed code examples for this in the "Add custom metrics" section of the Add and Modify OpenTelemetry in Application Insights documentation.
5. Hands-On Practice
Now it's time to apply what you've learned. You will modify the .NET Web API project you worked on in the previous lesson to add custom telemetry. We will use the TelemetryClient approach as it makes the concepts of events and metrics very explicit.
Instructions:
- Open Your Project: Open the .NET Web API project you instrumented in the previous lab.
- Inject
TelemetryClient: In yourWeatherForecastController.cs, add a private field forTelemetryClientand inject it into the constructor.using Microsoft.ApplicationInsights; // Add this using statement // ... [ApiController] [Route("[controller]")] public class WeatherForecastController : ControllerBase { private static readonly string[] Summaries = new[] { /* ... */ }; private readonly ILogger<WeatherForecastController> _logger; private readonly TelemetryClient _telemetryClient; // Add this field // Modify the constructor public WeatherForecastController(ILogger<WeatherForecastController> logger, TelemetryClient telemetryClient) { _logger = logger; _telemetryClient = telemetryClient; // Add this line } [HttpGet(Name = "GetWeatherForecast")] public IEnumerable<WeatherForecast> Get() { // ... controller logic } } - Track a Custom Event: Inside the
Get()method, add a call toTrackEvent. This event will signify that a forecast was requested and will include the user agent as a custom property.[HttpGet(Name = "GetWeatherForecast")] public IEnumerable<WeatherForecast> Get() { // Track the custom event var eventProperties = new Dictionary<string, string> { { "UserAgent", Request.Headers["User-Agent"].ToString() } }; _telemetryClient.TrackEvent("WeatherForecastRequested", eventProperties); return Enumerable.Range(1, 5).Select(index => new WeatherForecast { // ... existing code }) .ToArray(); } - Track a Custom Metric: Inside the same
Get()method, let's track the number of forecast days being returned.[HttpGet(Name = "GetWeatherForecast")] public IEnumerable<WeatherForecast> Get() { // ... code for tracking the event ... // Track the custom metric _telemetryClient.TrackMetric("ForecastDays", 5); return Enumerable.Range(1, 5).Select(index => new WeatherForecast // ... existing code } - Run and Verify:
- Run your application locally. Make sure your
appsettings.jsonstill has the connection string. - Use a browser or a tool like Postman to call the
/weatherforecastendpoint several times. - Go to your Application Insights resource in the Azure portal.
- Verify the event: Navigate to Usage > Events. After a few minutes, you should see "WeatherForecastRequested" in the list. Click on it to see samples and inspect the
UserAgentcustom property. - Verify the metric: Navigate to Monitoring > Metrics. In the metrics chart, select the Metric Namespace
Custom(orLog-based metrics), then choose the MetricForecastDays. You should see the data points you sent.
- Run your application locally. Make sure your
This hands-on exercise will take approximately 15 minutes.
Conclusion
In this lesson, you have gone beyond the default telemetry to instrument your application with meaningful, custom data.
Key Takeaways:
- Custom Events are for counting discrete occurrences (e.g., business actions).
- Custom Metrics are for tracking and aggregating numeric values over time.
- The
TelemetryClientclass, obtained via dependency injection, is the primary tool for sending custom telemetry with the Application Insights SDK. - The
TrackEventmethod sends custom events, which can be enriched withproperties(dimensions) andmetrics(measurements). - The
TrackMetricandGetMetricmethods send custom metrics, which can be viewed and aggregated in the Azure portal's Metrics Explorer.
Next Steps
Now that you are collecting both standard and custom telemetry, your Application Insights resource is filling up with valuable data. But how do you sift through it all to find the specific information you need? In our next lesson, we will introduce the Kusto Query Language (KQL), the powerful tool you will use to write foundational queries and analyze all the telemetry data you're collecting.