Hello! Welcome to the first lesson in our module on Advanced Multilevel Modeling.
In our previous module, you mastered the Social Relations Model (SRM), a powerful tool for analyzing the static, structural components of triadic relationships. We concluded by interpreting a full SRM analysis to tell a story about where emotional variation originates. However, SRM is best suited for cross-sectional "round-robin" data and gives us a snapshot in time. Your research, which aims to understand emotional dynamics as they unfold, requires a method that can handle repeated measurements over time.
This is where multilevel modeling (MLM) comes in. Today, we will lay the groundwork for this by focusing on how to correctly structure a model for your unique data. The goal is to specify a three-level model that accounts for the fact that you will have repeated emotional observations (Level 1) from individuals (Level 2), who are themselves part of a specific triad (Level 3). This hierarchical structure is the foundation for all the dynamic causal analyses we will build in the coming lessons.
From Two Levels to Three: Modeling Nested Data
When you collect data over time from multiple people—for example, using an experience sampling method (ESM) to capture jealousy scores several times a day—you are dealing with a nested data structure. The most basic form of this is a two-level structure: repeated measurements are nested within individuals.
The image below visualizes this two-level concept. Each colored line represents a different individual's trajectory. You can see that individuals start at different places (varying intercepts) and their outcomes change at different rates (varying slopes). Multilevel modeling is designed to capture precisely this kind of person-specific variation.
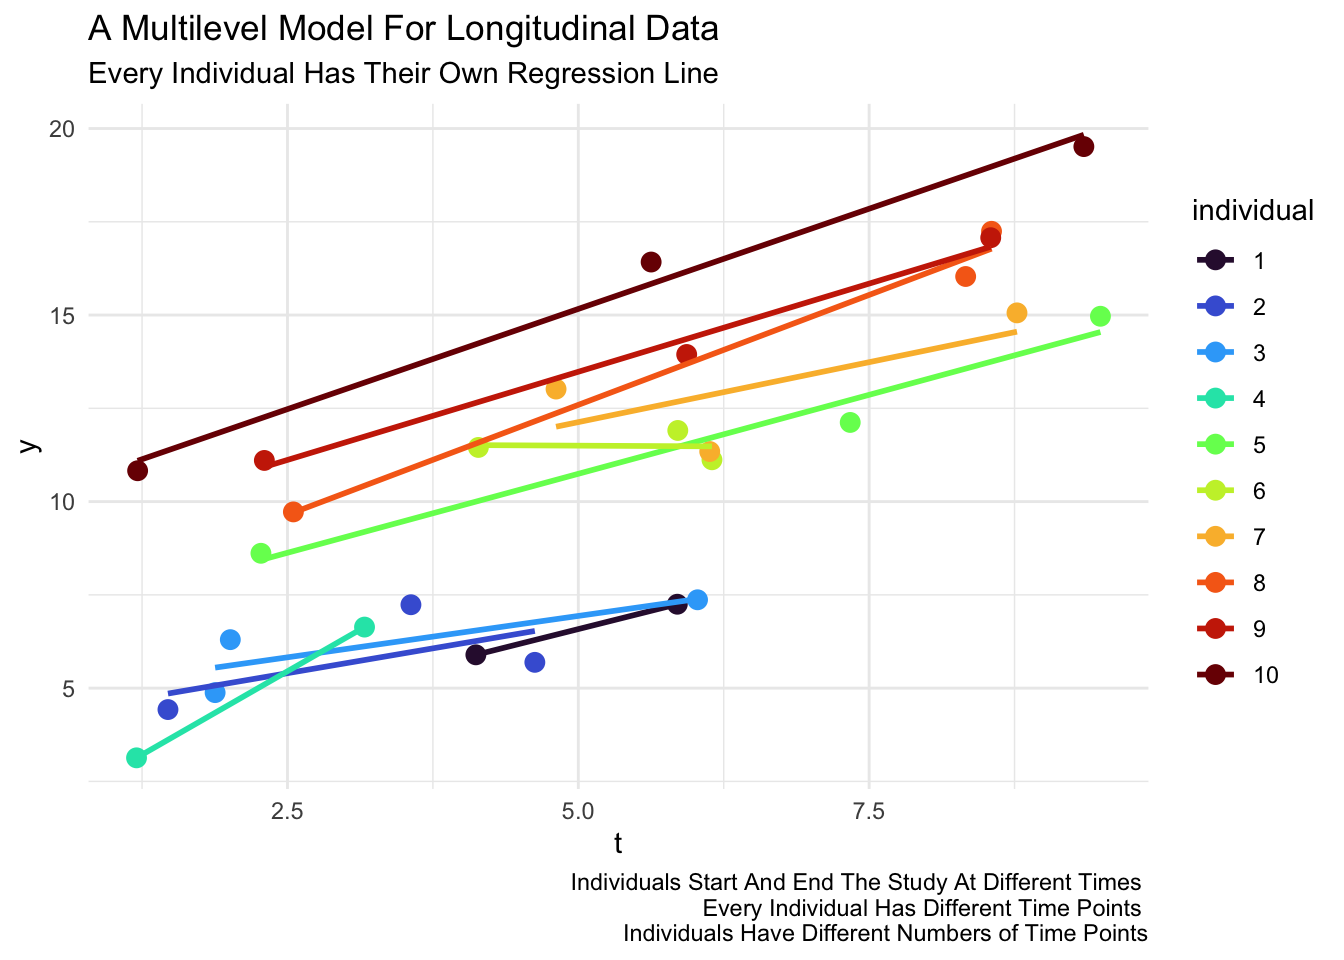
In your research, however, there's an additional layer of complexity. The individuals—husband, wife, and bull—are not independent of one another. They are all part of the same relational system, the triad. Two individuals in the same triad are likely to be more similar to each other in their emotional patterns than two individuals chosen from different triads. Ignoring this shared context would violate a key statistical assumption of independence and lead to incorrect standard errors and flawed inferences.
To address this, we must add a third level to our model.
- Level 1: The most granular level. This consists of the repeated emotional observations for each person (e.g., jealousy scores at different time points). Variation at this level represents a person's fluctuation around their own average trajectory. This answers the question: When does this person feel more or less jealous than their personal norm?
- Level 2: The intermediate level. This consists of the individuals (husband, wife, bull). Variation at this level represents the differences between the individuals within a given triad. This answers the question: Who, on average, feels more jealousy—the husband, the wife, or the bull in this specific triad?
- Level 3: The highest level. This consists of the triads. Variation at this level represents the differences between triads. This answers the question: Do some triads, as a whole, exhibit higher average levels of jealousy than other triads?
The following resource provides a concise overview of the logic behind a three-level model and how the total variance in an outcome is partitioned across these levels.
Three-Level Random Effects Models
These presentation slides from Dr. Lesa Hoffman clearly illustrate the concept of variance decomposition in a three-level model.
Focus on slides 2-5. Slide 2 defines the number of levels by the dimensions of sampling. Slides 3 and 4 provide the equations and a clear visual breakdown of how variance is partitioned into Level 1 (Within-Person), Level 2 (Between-Person, Within-Group), and Level 3 (Between-Group). This visual mapping is key to understanding the structure.
Formal Specification of a Three-Level Growth Model
With your background in statistics, you'll appreciate seeing the formal mathematical representation of this model. We will build it level by level, using the framework for a univariate growth model. The following paper by Curran and colleagues provides a rigorous, academic treatment of this model specification.
A MULTIVARIATE GROWTH CURVE MODEL FOR THREE ...
This paper provides the technical foundation for specifying three-level models for longitudinal data. We will focus on the univariate case, which directly applies to modeling a single emotional outcome like jealousy or guilt.
First, read the section "Three-Level Growth Models" to understand the justification for this structure. The example of cadets nested in squads is a direct analogue to your structure of individuals nested in triads. Next, carefully study the subsection "Three-Level Unconditional Univariate Growth Model". This is the core of today's lesson. Pay close attention to: Equation 19, which models change over time for a specific person. Equation 20, which models how individual trajectories vary around their group's (triad's) average. Equation 21, which models how the group (triad) averages vary around the overall grand average. The full composite model in Equation 22. The descriptions of the Level-2 variance components (\tau_{\pi}) and the Level-3 variance components (\tau_{\beta}).
Let's translate those equations from the Curran paper directly into your research context. Here, t is the observation time, i is the individual (1=Husband, 2=Wife, 3=Bull), and j is the triad. Let's say our outcome is the husband's jealousy score.
Level 1: Within-Person Change
This equation describes a single person's emotional trajectory over time.
- : The emotion score for person
iin triadjat timet. - : Person
i's initial level of the emotion (their intercept). - : Person
i's rate of change in the emotion over time (their slope). - : The deviation of person
i's score at timetfrom their own predicted trajectory. The variance of these residuals, , is the Level-1 variance. It quantifies moment-to-moment emotional fluctuation.
Level 2: Between-Person, Within-Triad Differences
These equations model how the intercepts and slopes from Level 1 vary across the three individuals within a single triad.
- : The average initial emotion level across the three individuals in triad
j. - : How person
i's initial emotion deviates from their triad's average. The variance of these deviations, , is the Level-2 intercept variance. It tells us how much the individuals within a triad differ in their baseline emotional levels. - : The average rate of change for triad
j. - : How person
i's rate of change deviates from their triad's average. The variance of these, , is the Level-2 slope variance.
Level 3: Between-Triad Differences
These final equations model how the average intercepts and slopes from Level 2 vary across different triads.
- : The grand mean initial emotion level across all individuals in all triads. This is a fixed effect.
- : How triad
j's average initial emotion deviates from the grand mean. The variance of these deviations, , is the Level-3 intercept variance. It quantifies how much triads differ from one another in their overall baseline emotion. - : The grand mean rate of change across all triads (a fixed effect).
- : How triad
j's average rate of change deviates from the grand mean. The variance of these, , is the Level-3 slope variance.
A Practical Glimpse
While the equations provide the formal specification, seeing how this is implemented in statistical software can help solidify the concepts. The following video demonstrates the setup of a three-level model in SPSS. You don't need to focus on the software specifics, but rather on how the conceptual levels are defined in the analysis.
Three-level multilevel modeling using SPSS 28 (March 2022)
This video provides a practical demonstration of running a three-level analysis. The example uses data on nurses nested within wards, nested within hospitals, which is analogous to individuals nested within dyads, nested within triads.
First, watch the introduction describing the data and nesting structure. This will help you map the concepts to a concrete example. Next, watch the demonstration of setting up the null model. Pay attention to how the "subjects" are specified hierarchically (hospital, then ward). This is how you would define triads (Level 3) and individuals (Level 2). Finally, observe the interpretation of the covariance parameters output, where the variance is explicitly partitioned into Level 1, Level 2, and Level 3 components. This shows the direct output of the variance terms (\sigma^2_e, \tau_{\pi}, \tau_{\beta}) we discussed.
Conclusion
In this lesson, we have established the theoretical and mathematical foundation for analyzing your triadic longitudinal data. You've learned why a three-level structure is essential and how to formally specify an unconditional growth model that correctly partitions the total emotional variance into its distinct sources.
Key Takeaways:
- Triadic longitudinal data requires a three-level model: observations (Level 1) nested within individuals (Level 2), who are nested within triads (Level 3).
- This structure is necessary to account for the non-independence of individuals sharing a common relational context (the triad).
- The model decomposes total variance into three meaningful components: within-person fluctuation, between-person (within-triad) differences, and between-triad differences.
- The variance of the random effects at each level (, , ) quantifies the amount of variation attributable to that level, helping you pinpoint the primary sources of emotional dynamics.
This "unconditional" or "empty" model is the essential first step. It tells us if there is significant variation at each level that needs explaining. In our next lesson, we will build upon this foundation by adding predictors to the model. Specifically, we will incorporate random slopes for time-varying covariates, which will allow us to examine how the emotional impact of specific lifestyle activities might differ from person to person within the triad.