Hello! In our last lesson, we constructed a three-level random intercept model, which was a crucial step in accounting for the nested structure of your data. That model allows each individual's average emotional level and each triad's average emotional level to differ. However, it operates on a key assumption: that the effect of any predictor we add is identical for every person.
Today, we will relax that constraint. This lesson addresses a core element of your research goal: modeling individual differences in emotional reactivity. We will move beyond random intercepts to incorporate random slopes. This technique allows you to statistically model and test the hypothesis that the emotional impact of specific lifestyle activities varies from person to person. For example, you can directly answer questions like, "Is the husband's jealousy response to a particular wife-bull activity stronger for some husbands than for others?"
From a Fixed Effect to Varying Reactivity
In the random intercept model from our last lesson, if we were to add a predictor like Activity_Occurrence, the model would estimate a single, fixed coefficient (a single slope) representing the average effect of that activity on an emotion like jealousy for everyone in the study.
However, it's highly plausible that this effect is not uniform. Some individuals may be highly reactive, others less so, and some may not react at all. This variation in reactivity is precisely what a random slope is designed to capture. Instead of one regression line representing the effect, imagine a unique line for each person, reflecting their personal sensitivity to the predictor.

This is a direct extension of the random intercept concept. Where a random intercept allows each person's line to shift up or down (a different starting point), a random slope allows each person's line to have a different tilt (a different rate of change).
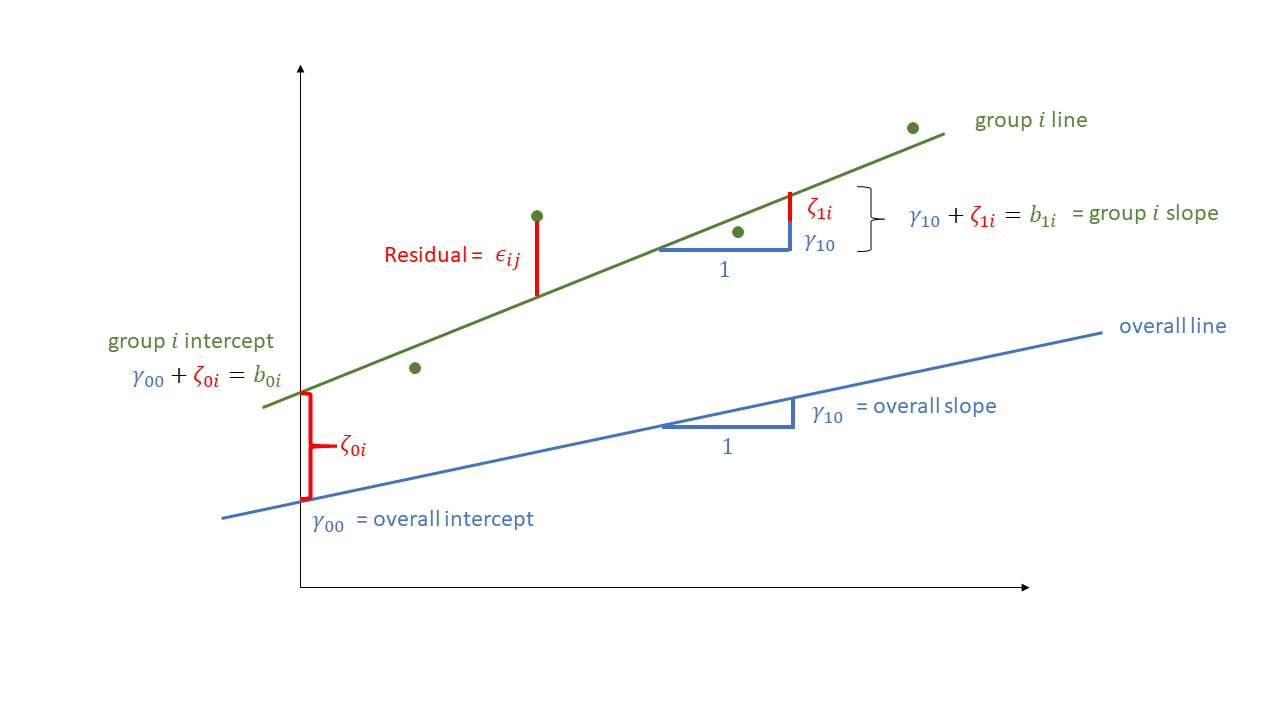
For a clear, formal definition of random intercepts and slopes, the following resource provides an excellent overview.
Using Multilevel Models for the Analysis of Event-Related ...
This paper provides an accessible introduction to the components of a multilevel model. While the application is in neuroscience, the statistical explanations are general and clear.
Read the section "Description of MLM and Its Advantages". Focus on the paragraph that begins "Unique to the MLM...". It concisely defines random intercepts and random slopes as unique effects estimated for each unit of a random factor (in your case, each individual).
Specifying a Random Slope Model
Let's expand the three-level model from our previous lesson to include a time-varying predictor and a random slope. Imagine you have a measure of a specific Activity (e.g., duration of wife-bull interaction, coded as ) and an outcome of the husband's Jealousy () for each observation t, for each individual i, in each triad j.
Level 1: Within-Person Model
The Level-1 equation now includes the Activity predictor. The coefficient for this predictor, , is now specific to each person i in triad j.
- : Person
i's baseline jealousy level (their intercept). - : Person
i's reactivity to the activity (their slope). - : The residual fluctuation for that person at that moment.
Level 2: Between-Person, Within-Triad Model
This is where we formally introduce the random slope. We now model both the intercepts () and the slopes () as varying across individuals within a triad.
- : The average baseline jealousy in triad
j. - : How person
i's baseline jealousy deviates from their triad's average. The variance of this term, , is the Level-2 random intercept variance. - : The average effect of the activity (average reactivity) in triad
j. - : How person
i's reactivity deviates from their triad's average. The variance of this term, , is the Level-2 random slope variance. A statistically significant value for is evidence of meaningful individual differences in emotional reactivity.
Level 3: Between-Triad Model
Finally, we model how the triad-average intercepts and slopes vary across different triads.
- : The grand mean baseline jealousy (fixed effect).
- : The grand mean effect of the activity across all individuals and triads (the overall fixed effect of the activity).
- & : The random effects for the triad, representing how triad
j's average intercept and slope deviate from the grand averages. Their variances, and , quantify between-triad differences.
Interpreting the Random Effects
The power of this model comes from its random effects components, which now form a variance-covariance matrix at each level. At Level 2 (the individual level), this matrix includes:
- The variance of the intercepts (): How much do individuals' baseline jealousy levels vary within a triad?
- The variance of the slopes (): How much do individuals' reactivity to the activity vary within a triad?
- The covariance of the intercepts and slopes (): Is there a relationship between a person's baseline jealousy and their reactivity?
This covariance term is particularly insightful. For example, a positive covariance would mean that individuals who have higher baseline jealousy also tend to be more reactive to the activity. A negative covariance would suggest that those with higher baseline jealousy are less reactive (perhaps indicating a ceiling effect).
The following two video clips provide an excellent walkthrough of specifying and interpreting these components.
Multilevel Models: Random Coefficient Models | Ian Brunton-Smith
This video from the National Centre for Research Methods introduces the random coefficient model and its variance components.
First, watch the conceptual introduction explaining the model. Then, pay close attention to the explanation of the variance-covariance matrix. This part clearly defines the intercept variance, the coefficient (slope) variance, and the crucial covariance term.
Multilevel Modeling for Intensive Longitudinal Data with Michael Russell
This presentation by Dr. Michael Russell on MLM for intensive longitudinal data gives a fantastic practical demonstration of fitting and visualizing a random slope model.
Watch the segment from "Elaborate our multi-level model". The presenter walks through adding a predictor with a random slope, interpreting the fixed effects (between- and within-person effects), and, most importantly, interpreting the random effects output from the statistical software, corresponding to the variance-covariance matrix we just discussed.
Visualizing and Understanding Random Slopes
While the variance parameters give you the statistical test, visualizing the results is key to interpretation. The best way to do this is with a "spaghetti plot," which overlays the estimated regression line for each individual. This plot makes the variance in intercepts (different starting heights) and slopes (different tilts) immediately apparent.
The same presentation by Dr. Russell provides a perfect example of creating and interpreting such a plot, and then connects it back to the intercept-slope covariance.
Multilevel Modeling for Intensive Longitudinal Data with Michael Russell
This segment builds directly on the previous clip, focusing on visualization.
Watch the portion from "if we were to estimate...". First, he shows a spaghetti plot and maps the fixed and random effects directly onto it. Then, he creates a scatter plot of each person's estimated intercept against their estimated slope to visualize the intercept-slope covariance. This provides a powerful, intuitive understanding of what that covariance term means.
Applying this to your work, you could create a plot showing the relationship between Activity and Husband's Jealousy. The main (fixed effect) slope might be positive, but the spaghetti plot would reveal if some husbands have very steep slopes (high reactivity), some have flat slopes (low reactivity), and if the intercept-slope covariance is significant, indicating that baseline jealousy predicts this reactivity.
An Advanced Topic: Modeling Variability in Emotion
Thus far, we've focused on how an activity influences the average level (the location) of an emotion. Random slopes model heterogeneity in this effect. However, you can take this a step further. Your statistical background allows for a look at more advanced techniques, such as the Mixed-Effects Location Scale Model (MELSM).
A MELSM allows you to model both the location (mean) and the scale (within-person variance) of an outcome. In your context, this means you could ask: "Does a certain activity make a person not only more jealous on average, but also more emotionally volatile or unpredictable?" You could model the within-person variance of jealousy as an outcome itself.
A Mixed-Effects Location Scale Model for Dyadic Interactions
This paper introduces the MELSM, a sophisticated extension of standard multilevel models. It's a challenging but powerful approach.
To grasp the core idea, read the subsection "Within-person variance". This explains how the error variance (\sigma^2_{\epsilon_{ij}}) can be modeled as an outcome that varies over time and across people. Then, look at the subsections "Location model" and "Scale model" in the illustrative example. These show the parallel model specifications for predicting the mean (location) and the variance (scale) of affect.
This is an advanced application, but it represents the cutting edge of modeling intensive longitudinal data and is highly relevant to understanding complex emotional dynamics like stability and volatility.
Conclusion
Today we've moved from a model of average differences to a model of differential reactivity. By incorporating random slopes, you can now directly test hypotheses about how and why individuals within a triad respond differently to the same relational events.
Key Takeaways:
- Random slopes allow the effect of a predictor to vary across individuals, providing a way to model and quantify individual differences in reactivity.
- The variance of the random slope is a key parameter that indicates whether there is significant heterogeneity in an effect.
- The covariance between the random intercept and random slope reveals whether an individual's baseline level on an outcome is related to their reactivity.
- Spaghetti plots are the ideal way to visualize random slope models, showing the unique estimated trajectory for each individual.
In our next lesson, we will address a different kind of complexity in your data. Our current three-level hierarchical model (observations in individuals in triads) is powerful, but it doesn't fully capture the overlapping dyadic relationships. For example, the wife is a member of both the husband-wife dyad and the wife-bull dyad. To model these non-nested, overlapping group structures, we will explore cross-classified multilevel models.