Welcome to the second module of our course. In the previous module, we laid the conceptual groundwork for our study. We defined the unique analytical challenges of triadic data and established precisely why standard statistical methods fall short by exploring the consequences of ignoring non-independence. You now have a firm grasp of the statistical pitfalls, such as inflated Type I errors and biased estimates, that motivate the need for the specialized models we will be exploring.
This lesson marks our shift from understanding the problem to actively building the solution. We will begin visualizing the complex web of causal relationships within the triad, starting with a foundational tool: the Directed Acyclic Graph (DAG). Our goal is to formally map out our theoretical assumptions about what causes what. Specifically, this lesson will guide you through constructing your first DAG, focusing on a single but crucial perspective: modeling the causal pathway from a wife-bull activity to the husband's subsequent experience of jealousy. This exercise will provide you with the vocabulary and systematic process needed to map the more complex, interdependent structures in the lessons to come.
The Language of Causality: An Introduction to DAGs
Before we can model complex dynamics, we need a clear, unambiguous language to state our causal hypotheses. A verbal theory can be rich with nuance but also rife with ambiguity. A Directed Acyclic Graph (DAG) is a visual formalism that forces us to be explicit about our assumptions regarding the data-generating process. It serves as a bridge between our conceptual understanding and our statistical model.
To begin, let's watch a brief introduction to the core concepts of causal inference and why graphical models like DAGs are so essential.
Introduction to Causal Inference and Directed Acyclic Graphs
This video, "Introduction to Causal Inference and Directed Acyclic Graphs" from The Ohio State University Libraries, provides an excellent primer on moving from the familiar mantra of "correlation is not causation" to a more rigorous, causal framework.
Please watch the first part of the presentation, from the introduction to the speaker's main argument (). Focus on the core argument: rather than avoiding causal language, we should embrace our causal questions and use formal tools to answer them rigorously.
As the video argues, the goal isn't to stop making causal claims but to make them defensible. A DAG is our primary tool for this. It is composed of a few simple elements that allow us to represent complex systems. Let's cover the basic anatomy.
Introduction to Causal Inference and Directed Acyclic Graphs
The same video provides a concise overview of the key components of a DAG.
Watch the segment from the anatomy of a DAG. Pay close attention to the definitions of: Nodes: The variables in our system. Arcs (Arrows): The direct causal relationships we hypothesize. Causal Paths: A sequence of arrows pointing in the same direction. Confounding Paths (Backdoor Paths): A path from an exposure to an outcome that runs through a common cause (a confounder). These paths are the source of spurious correlation. Conditioning: The statistical act of "adjusting for" or "controlling for" a variable, which is used to block confounding paths.
A Systematic Approach to Building a DAG
With the basic vocabulary in place, how do we go about constructing a DAG for a specific research question? The process is not arbitrary; it's a systematic application of your subject-matter expertise. The key is to build the graph recursively, starting from the core relationship of interest and progressively adding other relevant variables.
A short video from the SAS Users channel provides a clear, step-by-step method.
Building and Using DAGs for Causal Inference
This video, "Building and Using DAGs for Causal Inference," demonstrates a practical, recursive method for specifying a DAG.
Watch the section on how to create a DAG. The process outlined is: Start with the core causal mechanism: your exposure (treatment), outcome, and any key mediators. Recursively add the common causes of any two variables already in the graph. Continue until all meaningful causal pathways are represented.
To this excellent advice, we can add a few more practical recommendations from the Ohio State University video. When you draw your DAG, you should:
- Define the focal relationship (exposure and outcome) first.
- Draw nodes in temporal order from left to right. Causes must precede effects.
- Include all relevant variables, even those you cannot measure (these are called latent or unobserved variables).
- Default to including an arrow unless you have a strong theoretical reason to assume no causal effect exists. It is a stronger claim to exclude an arrow than to include one.
Application: Modeling the Causal Pathway to Husband's Jealousy
Now, let's apply this systematic process to our learning outcome: constructing a DAG for the causal path from a wife-bull activity to the husband's jealousy.
Step 1: Define the Focal Relationship
Our process begins by identifying the primary exposure and outcome.
- Exposure (X): A specific
Wife-Bull Activity(WBA). For now, we can treat this as a single event, such as a sexual encounter. - Outcome (Y): The
Husband's Jealousylevel measured after the event.
The most basic DAG is simply an arrow from exposure to outcome:Wife-Bull Activity -> Husband's Jealousy
Step 2: Deconstruct the Causal Pathway (Add Mediators)
The effect of a WBA on the husband's jealousy is not a black box. It's mediated by his internal psychological process: his thoughts and feelings. A highly relevant paper on romantic jealousy by Bevan (2009) outlines a structured, four-step model that we can adapt to map this internal pathway.
UNDERSTANDING ROMANTIC JEALOUSY: - UDSpace
This paper proposes a sequential model of how an individual processes a jealousy-inducing event. This provides an excellent theoretical scaffold for the mediating variables in our DAG.
First, read the description of the four-step model, starting from the overview. This introduces the sequence: Event -> Attributions -> Emotions -> Responses. Then, read the more detailed explanation of the 'actor's' process, from the jealousy-inducing event through the cognitive and emotional stages.
Translating Bevan's model into nodes for our DAG, the causal path looks like this:
- A
Wife-Bull Activityoccurs (the "jealousy inducing event"). - The husband makes a
Cognitive Appraisal / Attributionabout the event (e.g., "This threatens our bond," "I'm being neglected," "This is just for fun"). - This appraisal triggers a set of
Primary Emotions(e.g., fear, anger, sadness). - These primary emotions coalesce into the complex state we label
Husband's Jealousy.
Our DAG's causal chain now becomes more detailed:WBA -> Attribution -> Primary Emotion -> Jealousy
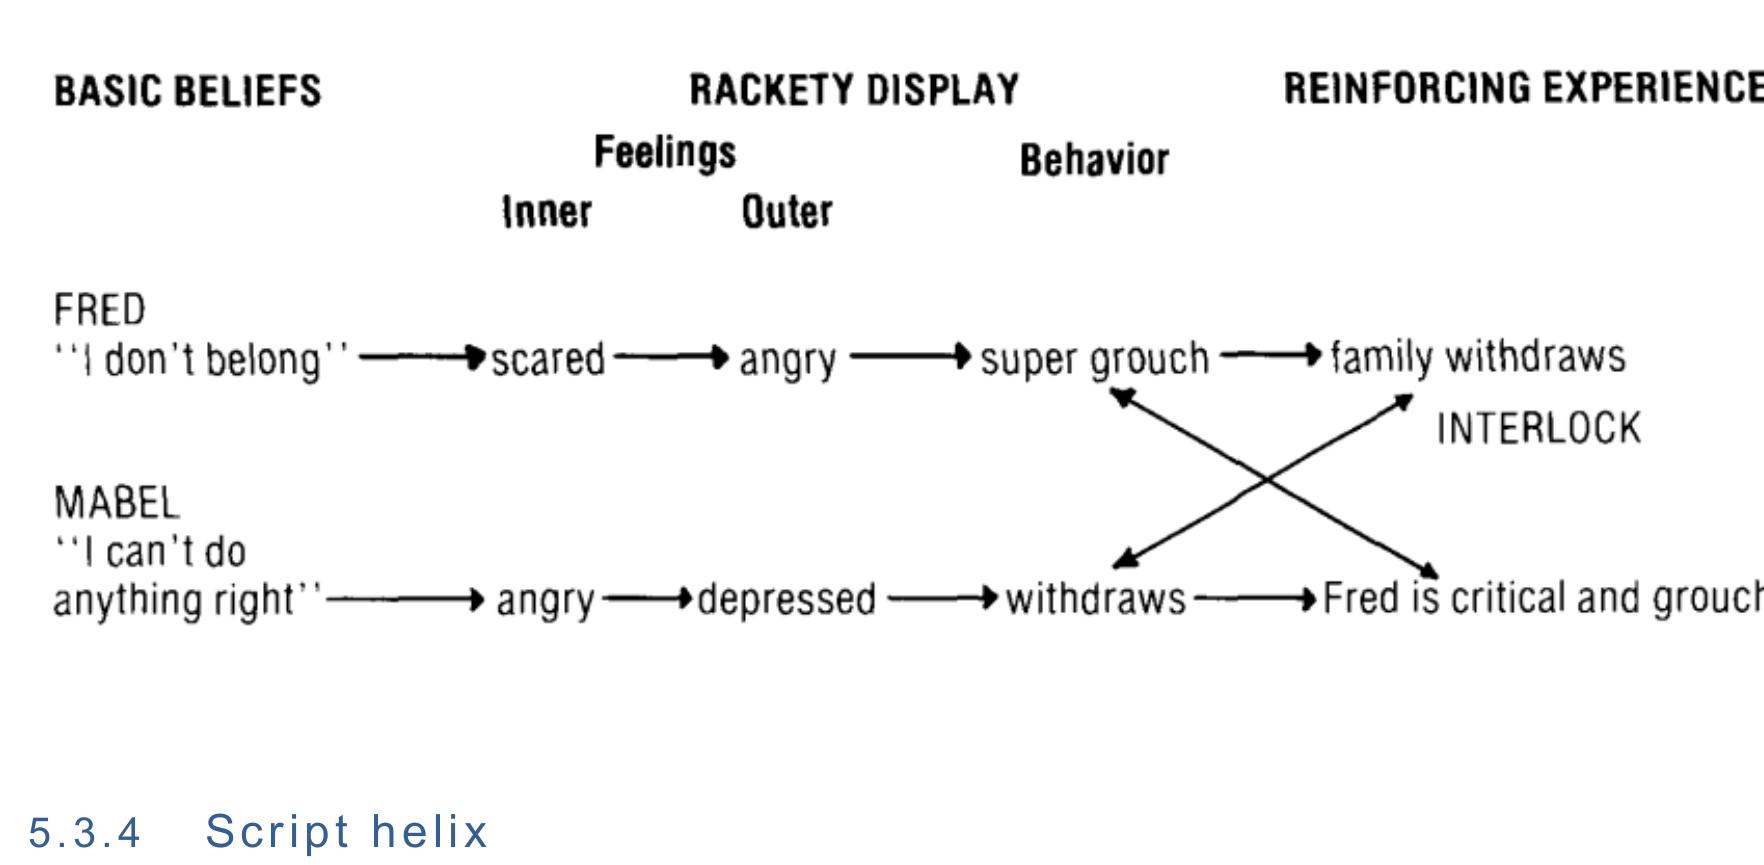
This kind of cognitive-behavioral sequence is common in relationship analysis. The "Script Helix" model, for example, illustrates a very similar dynamic where an individual's core beliefs trigger a sequence of feelings and behaviors that interlock with a partner's response.
Step 3: Add Common Causes (Confounders)
Now we must recursively ask: what are the common causes of the variables already in our graph? These are our potential confounders.
- Husband's Disposition: Stable personality traits like attachment style, self-esteem, or neuroticism. This disposition will certainly affect his tendency to make threatening
Attributionsand his baseline propensity forJealousy. Since it's a pre-existing trait, it's a confounder. - Marital Quality: The pre-existing level of trust, satisfaction, and intimacy in the marriage. Poor
Marital Qualitycould influence the nature of theWBA(e.g., leading to more detached or secretive encounters) and also make the husband more likely to form negativeAttributions. It is a common cause of variables on both sides of the causal chain. - Husband's Coping Skills: His learned ability to manage difficult emotions, drawing on skills like mindfulness, emotional regulation, and distress tolerance. Research specific to polyamory shows these skills are crucial mediators.
[PDF] polyamorous individuals' jealous and compersive responses to
This thesis provides empirical evidence for the specific mechanisms individuals use to manage jealousy, which we can incorporate into our DAG.
Please read the sections describing two key mechanisms: Emotion Regulation and Distress Tolerance. Note how these are proposed as skills that mediate the relationship between a trigger and the final emotional outcome.
These coping skills are an attribute of the husband that affects how he processes the Primary Emotion into the final Jealousy outcome. We can add Coping Skills as a node that influences Jealousy.
- Disclosure Context: The manner in which the husband learns about the WBA. Was it through open, reassuring communication from his wife beforehand, or did he discover it accidentally? This
Disclosure Contextis a direct cause of hisAttribution.
The Resulting DAG
By assembling these components in temporal order, we arrive at our initial DAG for the husband's perspective. Unobserved variables are shown with a dashed border.
A DAG representing the causal pathway to the husband's jealousy. Pre-existing factors (Marital Quality, Husband's Disposition) influence both the Wife-Bull Activity and the husband's internal processing. The activity, combined with the disclosure context, triggers a cognitive attribution, which leads to a primary emotion. This emotion's evolution into the final jealousy outcome is moderated by the husband's coping skills.
This graph makes our theory explicit. It hypothesizes, for instance, that the total causal effect of a Wife-Bull Activity on Husband's Jealousy is confounded by pre-existing Marital Quality and the Husband's Disposition. To isolate the true effect of the WBA, a statistical analysis based on this DAG would need to condition on (i.e., adjust for) these two confounders to block the "backdoor paths" they create.
Conclusion
In this lesson, we transitioned from theory to practice by constructing our first Directed Acyclic Graph. We established that DAGs are the formal language we use to state and scrutinize our causal assumptions, providing a blueprint for our statistical analysis. By following a systematic, recursive process, we built a model for a single, crucial perspective: the causal pathway from a wife-bull activity to the husband's jealousy.
Key Takeaways:
- DAGs are visual tools for making causal assumptions explicit and identifying confounders.
- A systematic process for building a DAG involves starting with the focal relationship (exposure -> outcome), adding mediators, and recursively adding common causes.
- Applying this to the husband's perspective, we modeled jealousy not as a direct reaction, but as the end-product of a cognitive-emotional sequence: Event -> Attribution -> Primary Emotion -> Final Outcome.
- We identified key confounders, such as
Husband's DispositionandMarital Quality, which must be accounted for to estimate the true causal effect of the activity.
This DAG represents just one piece of the puzzle. In our next lesson, we will broaden our focus to construct a DAG for a dyadic perspective, modeling the causal paths linking wife-bull activities, their communication, and the emotional outcomes within the wife-bull dyad itself.