Hello! Welcome to our next lesson.
In the previous session, we established a robust error handling strategy, creating custom exceptions and mapping them to clear, consistent HTTP responses. As we concluded, once you've caught and reported an error, the next logical step is to record it for diagnostics and monitoring. This brings us directly to today's topic.
This lesson addresses the learning outcome: Configure and use SLF4J with Logback for structured application logging. We'll explore how to effectively generate logs in a Spring Boot application, from simple human-readable console output to structured, machine-readable JSON logs that are essential for modern observability platforms. Given your background in system design, you'll find the principles behind Java's logging ecosystem and the power of structured logging particularly relevant for building scalable, maintainable services.
1. The Java Logging Landscape: Why SLF4J?
If you were to search for "Java logging," you'd find a dizzying array of options: Java Util Logging (JUL), Log4j, Log4j2, Commons Logging, Logback, and SLF4J. This complexity is often dubbed "logging hell." To understand why Spring Boot makes the choices it does, we need to understand the problem these libraries solve.
The core issue is that if your application uses one logging library (e.g., Logback) but one of its dependencies uses another (e.g., Log4j), you end up with two separate, uncoordinated logging systems.
The solution, which has become the industry standard, is to use a logging facade. A facade provides a generic API that your application code uses, while the actual logging work is delegated to a concrete implementation that you can plug in at runtime.
SLF4J (Simple Logging Facade for Java) is the most popular logging facade.
Logback vs SLF4J vs Log4J2 - what is the difference? Java Brains Brain Bytes
To get a sense of the history and the problem SLF4J solves, watch this short video 'Logback vs SLF4J vs Log4J2' from the excellent Java Brains channel. It provides the 'why' behind the facade pattern in logging.
Watch from 04:39 to 09:08. Pay close attention to the explanation of facade libraries, why they are crucial for library developers, and the final recommended strategy.
As the video explains, the winning strategy is:
- Code against the SLF4J API: Your application code should only depend on SLF4J interfaces.
- Choose a logging implementation: Provide a concrete logging library like Logback or Log4j2 on the classpath to do the actual work.
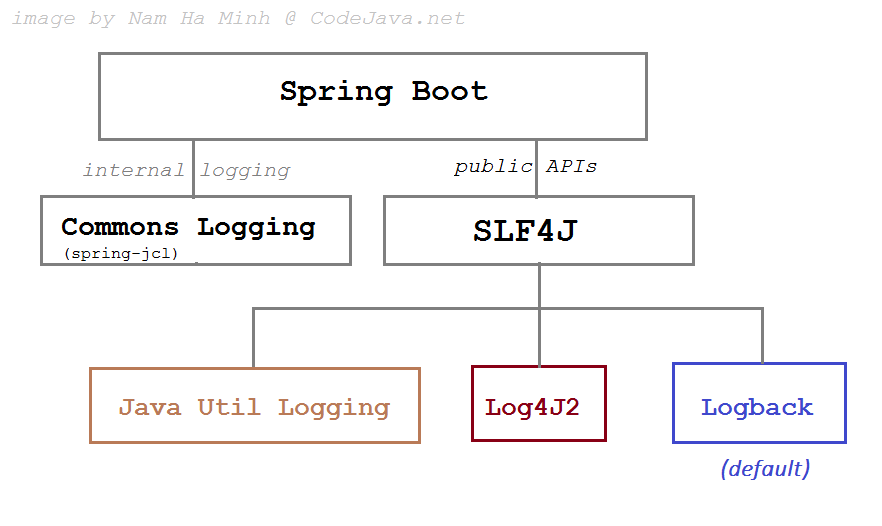
Spring Boot fully embraces this strategy. By default, it includes SLF4J as the API and Logback as the implementation. It also cleverly provides "bridges" to route logs from other frameworks that might be used by your dependencies through SLF4J, giving you one unified logging system.
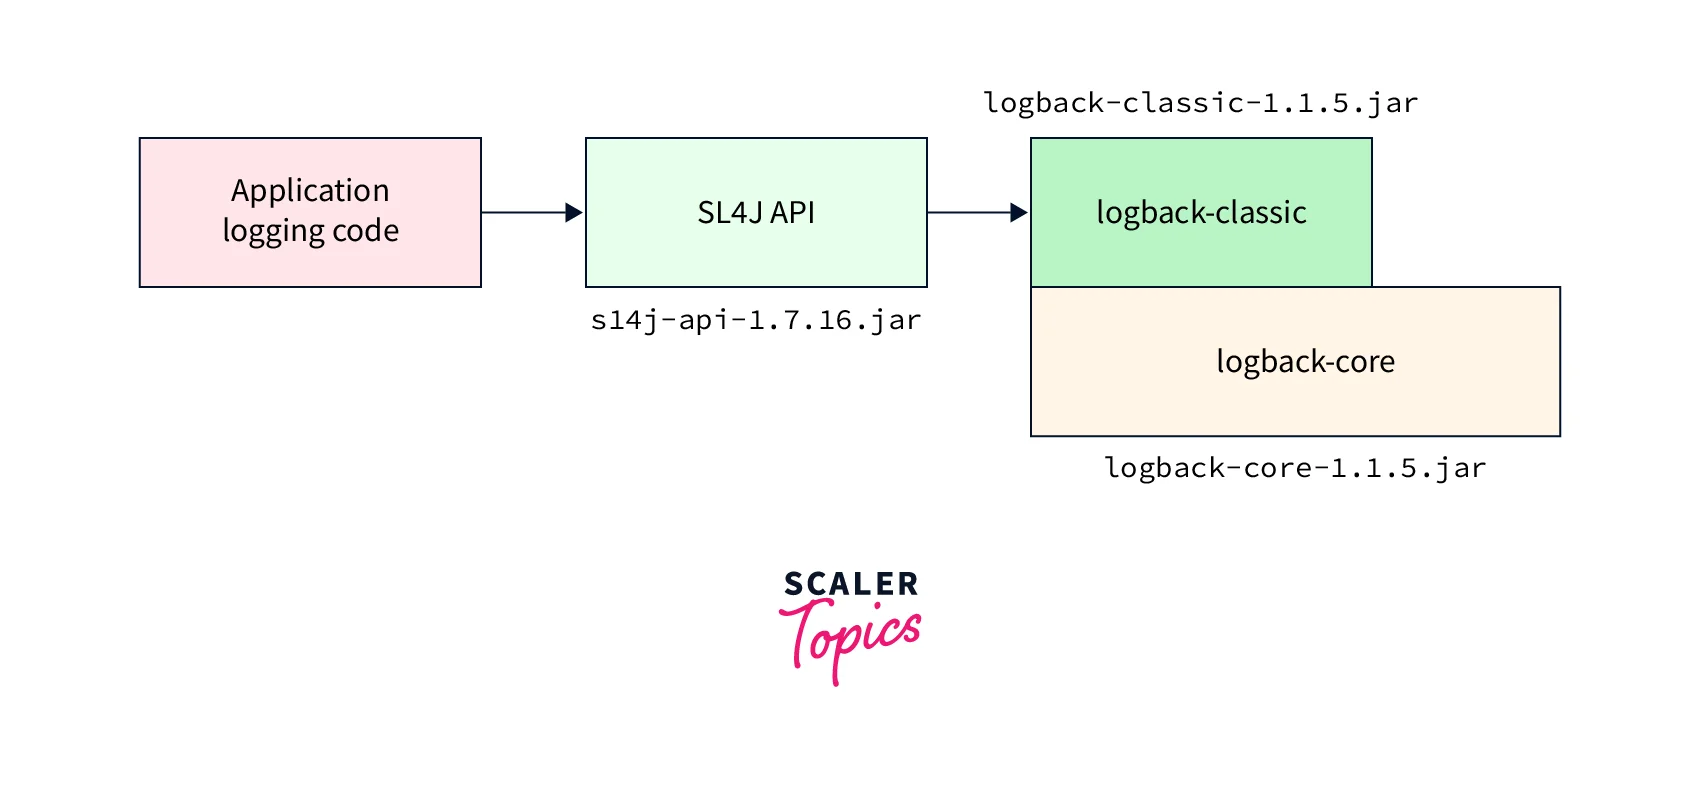
The diagrams below visualize this architecture. The first shows how SLF4J acts as a facade over various implementations within Spring Boot, and the second zooms in on the specific interaction between your code, the SLF4J API, and the Logback implementation.
2. Basic Logging in a Spring Boot Application
Thanks to Spring Boot's auto-configuration, you can start logging immediately without any setup.
To get a logger instance in a class, you use the LoggerFactory from SLF4J.
import org.slf4j.Logger;
import org.slf4j.LoggerFactory;
import org.springframework.stereotype.Service;

@Service
public class MyService {
    private static final Logger log = LoggerFactory.getLogger(MyService.class);

    public void doSomething() {
        log.info("Doing something important...");
    }
}
A very common and convenient shortcut, if you are using Project Lombok in your project (which Spring Initializr often includes), is the @Slf4j annotation. It generates the log field for you automatically at compile time.
import lombok.extern.slf4j.Slf4j;
import org.springframework.stereotype.Service;

@Service
@Slf4j
public class MyService {
    public void doSomething() {
        log.info("Doing something important with @Slf4j...");
    }
}
Log Levels and Parameterized Messages
SLF4J provides five main logging levels. Understanding when to use each is key to producing useful logs without flooding your system.
Slf4j, Lockback and Log4J2 | Spring Boot Backend #10
The video 'Slf4j, Lockback and Log4J2' from The Dev World channel gives a great practical overview of the log levels and an important performance tip.
Watch from the beginning to 04:57. Focus on the explanation of the five log levels (error, warning, info, debug, trace) and the best practices for using them. Also, pay attention to the point about using curly-brace {} placeholders for performance.
As highlighted in the video, here's a quick summary:
- ERROR: For critical, unrecoverable errors. This is where you would log the exceptions caught by the
@ExceptionHandlermethods we built in the last lesson. - WARN: For potential problems or recoverable errors (e.g., falling back to a cache because a network call failed).
- INFO: For high-level, business-relevant events (e.g., user login, order placed). These are your application's "audit trail."
- DEBUG: For fine-grained information useful for debugging problems (e.g., method entry/exit, important variable values).
- TRACE: For extremely detailed, low-level information (e.g., steps within a complex algorithm).
Always use parameterized logging (log.info("User {} created", userId)) instead of string concatenation (log.info("User " + userId + " created")). If the INFO level is disabled, the first version avoids the cost of string concatenation entirely, while the second version performs the concatenation needlessly before discovering the log message will be discarded.
3. Configuration with application.properties
Spring Boot allows you to control logging easily through your application.properties or application.yml file.
Setting Log Levels
You can set the log level for the entire application (the root logger) or for specific packages. This is extremely useful for quieting noisy libraries or getting more detail from your own code during development.
The official Spring Boot documentation provides the definitive guide to property-based logging configuration.
Read the section titled 'Log Levels'. It shows the syntax for setting the root level and package-specific levels in application.properties.
For example, to set the default log level to WARN but enable DEBUG logging for your application's packages, you would add this to application.properties:
logging.level.root=WARN
logging.level.com.yourcompany.yourapp=DEBUG
Writing to a File
By default, Spring Boot logs only to the console. To write logs to a file, you can use the logging.file.name or logging.file.path properties.
Let's return to the Spring Boot documentation to see how to configure file output.
Read the section 'File Output'. The table clearly explains how logging.file.name and logging.file.path work. By default, logs rotate when the file reaches 10 MB.
Example application.properties:
# Log to a file named 'app.log' in the current directory
logging.file.name=app.log
For more advanced configuration, like custom rotation policies or different log formats for console and file, you would typically use a logback-spring.xml file. While we won't detail that here, it's the next step for fine-grained control and is well-documented in the Spring Boot reference.
4. Structured Logging
While human-readable logs are great for development, they are difficult for machines to parse. In production, especially in a microservices environment, you'll want to aggregate logs from many services into a central system (like Elasticsearch, Splunk, or Datadog).
Structured logging is the practice of writing logs in a consistent, machine-readable format like JSON. This allows you to easily search, filter, and analyze your logs (e.g., "show me all ERROR logs for userId=123 from the payment-service").
Spring Boot makes enabling structured logging incredibly simple.
The Spring Boot documentation has a dedicated section on its built-in support for structured logging formats like ECS (Elastic Common Schema) and Logstash.
Read the introductory part of the 'Structured Logging' section, up to and including the subsection 'Elastic Common Schema'. Focus on how to enable it with a single property and see the example JSON output.
To enable the Elastic Common Schema (ECS) format for your console logs, you just need to add one line to your application.properties:
logging.structured.format.console=ecs
With this change, a simple log.info("User logged in") will produce a JSON output similar to this, instead of the plain text line:
{"@timestamp":"2024-08-23T10:15:00.067Z","log":{"level":"INFO","logger":"com.yourcompany.yourapp.MyService"},"process":{"pid":39599,"thread":{"name":"main"}},"service":{"name":"your-app-name"},"message":"User logged in","ecs":{"version":"8.11"}}
Enriching Structured Logs
The real power comes from adding your own contextual data to the logs.
Structured logging in Spring Boot 3.4
This Spring blog post provides a great, practical guide on how to add custom fields to your structured logs.
Read the section 'Add additional fields'. It demonstrates two powerful techniques: using Mapped Diagnostic Context (MDC) and the SLF4J fluent logging API.
As the article shows, you have two primary ways to add key-value pairs:
-
SLF4J Fluent API (recommended for single log statements):
log.atInfo()
   .setMessage("Processing payment")
   .addKeyValue("orderId", "a1b2-c3d4")
   .addKeyValue("amount", 99.99)
   .log();
This will automatically add
orderIdandamountfields to your JSON log entry. -
Mapped Diagnostic Context (MDC) (for context across multiple log statements): This is useful in web request threads to log, for example, a
traceIdoruserIdwith every log message within that thread's execution.// Typically done in a servlet filter or Spring interceptor MDC.put("userId", "user-456"); try { // All log statements in this block will have "userId": "user-456" log.info("Starting operation."); // ... some work ... log.info("Finishing operation."); } finally { MDC.remove("userId"); // Clean up to prevent memory leaks }
Conclusion
In this lesson, we demystified the Java logging ecosystem and saw how Spring Boot provides a powerful, simplified experience out of the box. You now have the tools to create effective and maintainable logging for your applications.
Key Takeaways:
- Code against the SLF4J facade: This decouples your application from a specific logging implementation.
- Spring Boot defaults to Logback: It provides a robust, pre-configured logging setup.
- Use
application.propertiesfor simple configuration: Control log levels and file output with ease. - Embrace structured logging: For production and distributed systems, enable JSON logging with a single property to make logs searchable and analyzable.
- Enrich your logs with context: Use the SLF4J fluent API or MDC to add critical business data (like user IDs or transaction IDs) to your structured logs.
We've now covered how to build your application logic, handle errors, and observe its behavior through logging. The next critical step is to ensure it all works as expected. In our next lesson, we will begin the module on testing and cover the outcome: Write a basic unit test for a Java class using JUnit 5 and Mockito.