Hello! Welcome to the final lesson in the "Graphs of Functions and Transformations" module.
In our last lesson, you learned the rules for transforming graphs by shifting, stretching, and reflecting them. Today, we'll shift our focus from manipulating graphs to interpreting them in a real-world context: kinematics, the study of motion. This topic is a fantastic bridge between mathematics and physics, drawing on your interests in both.
Your learning outcome for this lesson is to solve kinematic problems by calculating speed, acceleration, and distance from distance-time and speed-time graphs. Mastering this is crucial, as these questions frequently appear on IGCSE papers and require careful graph interpretation—an area you've identified for improvement.
The Two Fundamental Kinematic Graphs
In kinematics, almost everything revolves around two types of graphs. A common mistake students make is confusing them, so always check your axes first!
- Distance-Time Graphs: Show how far an object has travelled from a starting point over time.
- Speed-Time Graphs: Show how an object's speed changes over time.
Let's break down how to read each one.
IGCSE Physics - Speed, Velocity, Acceleration & Graphs
This resource from Tutopiya provides an excellent summary of the key features of both graph types. We'll use it as our foundation.
First, read the 'Graph Interpretation Summary' at the bottom of the page. This gives a very concise overview of what the gradient and other features mean for each graph type. Keep these two summaries in mind as we go through the lesson.
1. Interpreting Distance-Time Graphs
On a distance-time graph, the y-axis is distance and the x-axis is time.
- Gradient = Speed: The most important rule for these graphs is that the gradient of the line represents the object's speed.
- Horizontal Line: A gradient of zero means the speed is zero. The object is stationary.
- Straight, Sloping Line: A constant, non-zero gradient means the object is moving at a constant speed. The steeper the line, the faster it's moving.
- Curved Line: A changing gradient means the speed is changing (i.e., the object is accelerating or decelerating).
Worked Example: Distance-Time Graph
Let's look at a typical exam problem.

Analysis of the problem:
- Part (a) Average Speed: To find the average speed for the journey to the office, we need the total distance traveled and the total time taken for that part of the journey.
- From the graph, the total distance to the office is 28 km.
- The total time taken is 10:30 - 08:30 = 2 hours.
- Average Speed = Total Distance / Total Time = 28 km / 2 hours = 14 km/h.
- Part (b) Completing the graph: Kai returns home at a constant speed of 21 km/h.
- Distance to travel = 28 km.
- Time = Distance / Speed = 28 km / 21 km/h = 4/3 hours.
- 4/3 hours = 1 hour and 1/3 of an hour = 1 hour and 20 minutes.
- He leaves the office at 17:30. His arrival time is 17:30 + 1h 20m = 18:50.
- To complete the graph, we draw a straight line from the point (17:30, 28 km) down to (18:50, 0 km).
2. Interpreting Speed-Time Graphs
Speed-time graphs are more common in exams and contain more information. The y-axis is speed, and the x-axis is time. There are two key rules to remember.
-
Gradient = Acceleration:
- Positive gradient: Positive acceleration (speeding up).
- Negative gradient: Negative acceleration, or deceleration (slowing down).
- Zero gradient (horizontal line): Zero acceleration, meaning constant speed.
-
Area under the Graph = Distance Travelled:
- If you multiply Speed (y-axis) by Time (x-axis), you get Distance. Therefore, the area under the graph represents the total distance.
- You can almost always find this area by splitting it into simple shapes: triangles, rectangles, and trapeziums.
Let's consolidate these two rules with a clear, focused resource.
Speed-Time Graphs by Save My Exams
The revision notes from Save My Exams are excellent for this topic. They clearly define the two main rules and provide a perfect worked example.
Read through the entire page. Pay close attention to: The definitions of what gradient and area represent. The worked example, which shows exactly how to calculate acceleration (gradient) and distance (area) from a trapezium-shaped graph.
Now, let's see these rules applied in a video walkthrough of some typical exam questions.
All of iGCSE Speed Distance Time: What You Need To Know
This video by Ginger Mathematician provides a very practical, exam-focused walkthrough of how to approach these problems. Notice how he breaks down the graph into simple shapes.
Watch the following clips: Basic Acceleration and Distance (00:33 - 03:22): This covers the fundamentals. He calculates acceleration for the first section (gradient of the triangle) and the total distance (area of the triangle + area of the rectangle). Deceleration (16:56 - 18:53): This example shows how to calculate deceleration, which is simply a negative gradient. He also reinforces the calculation of total distance.
Test your understanding!
Look at the graph from the worked example in the Save My Exams resource (LINK).
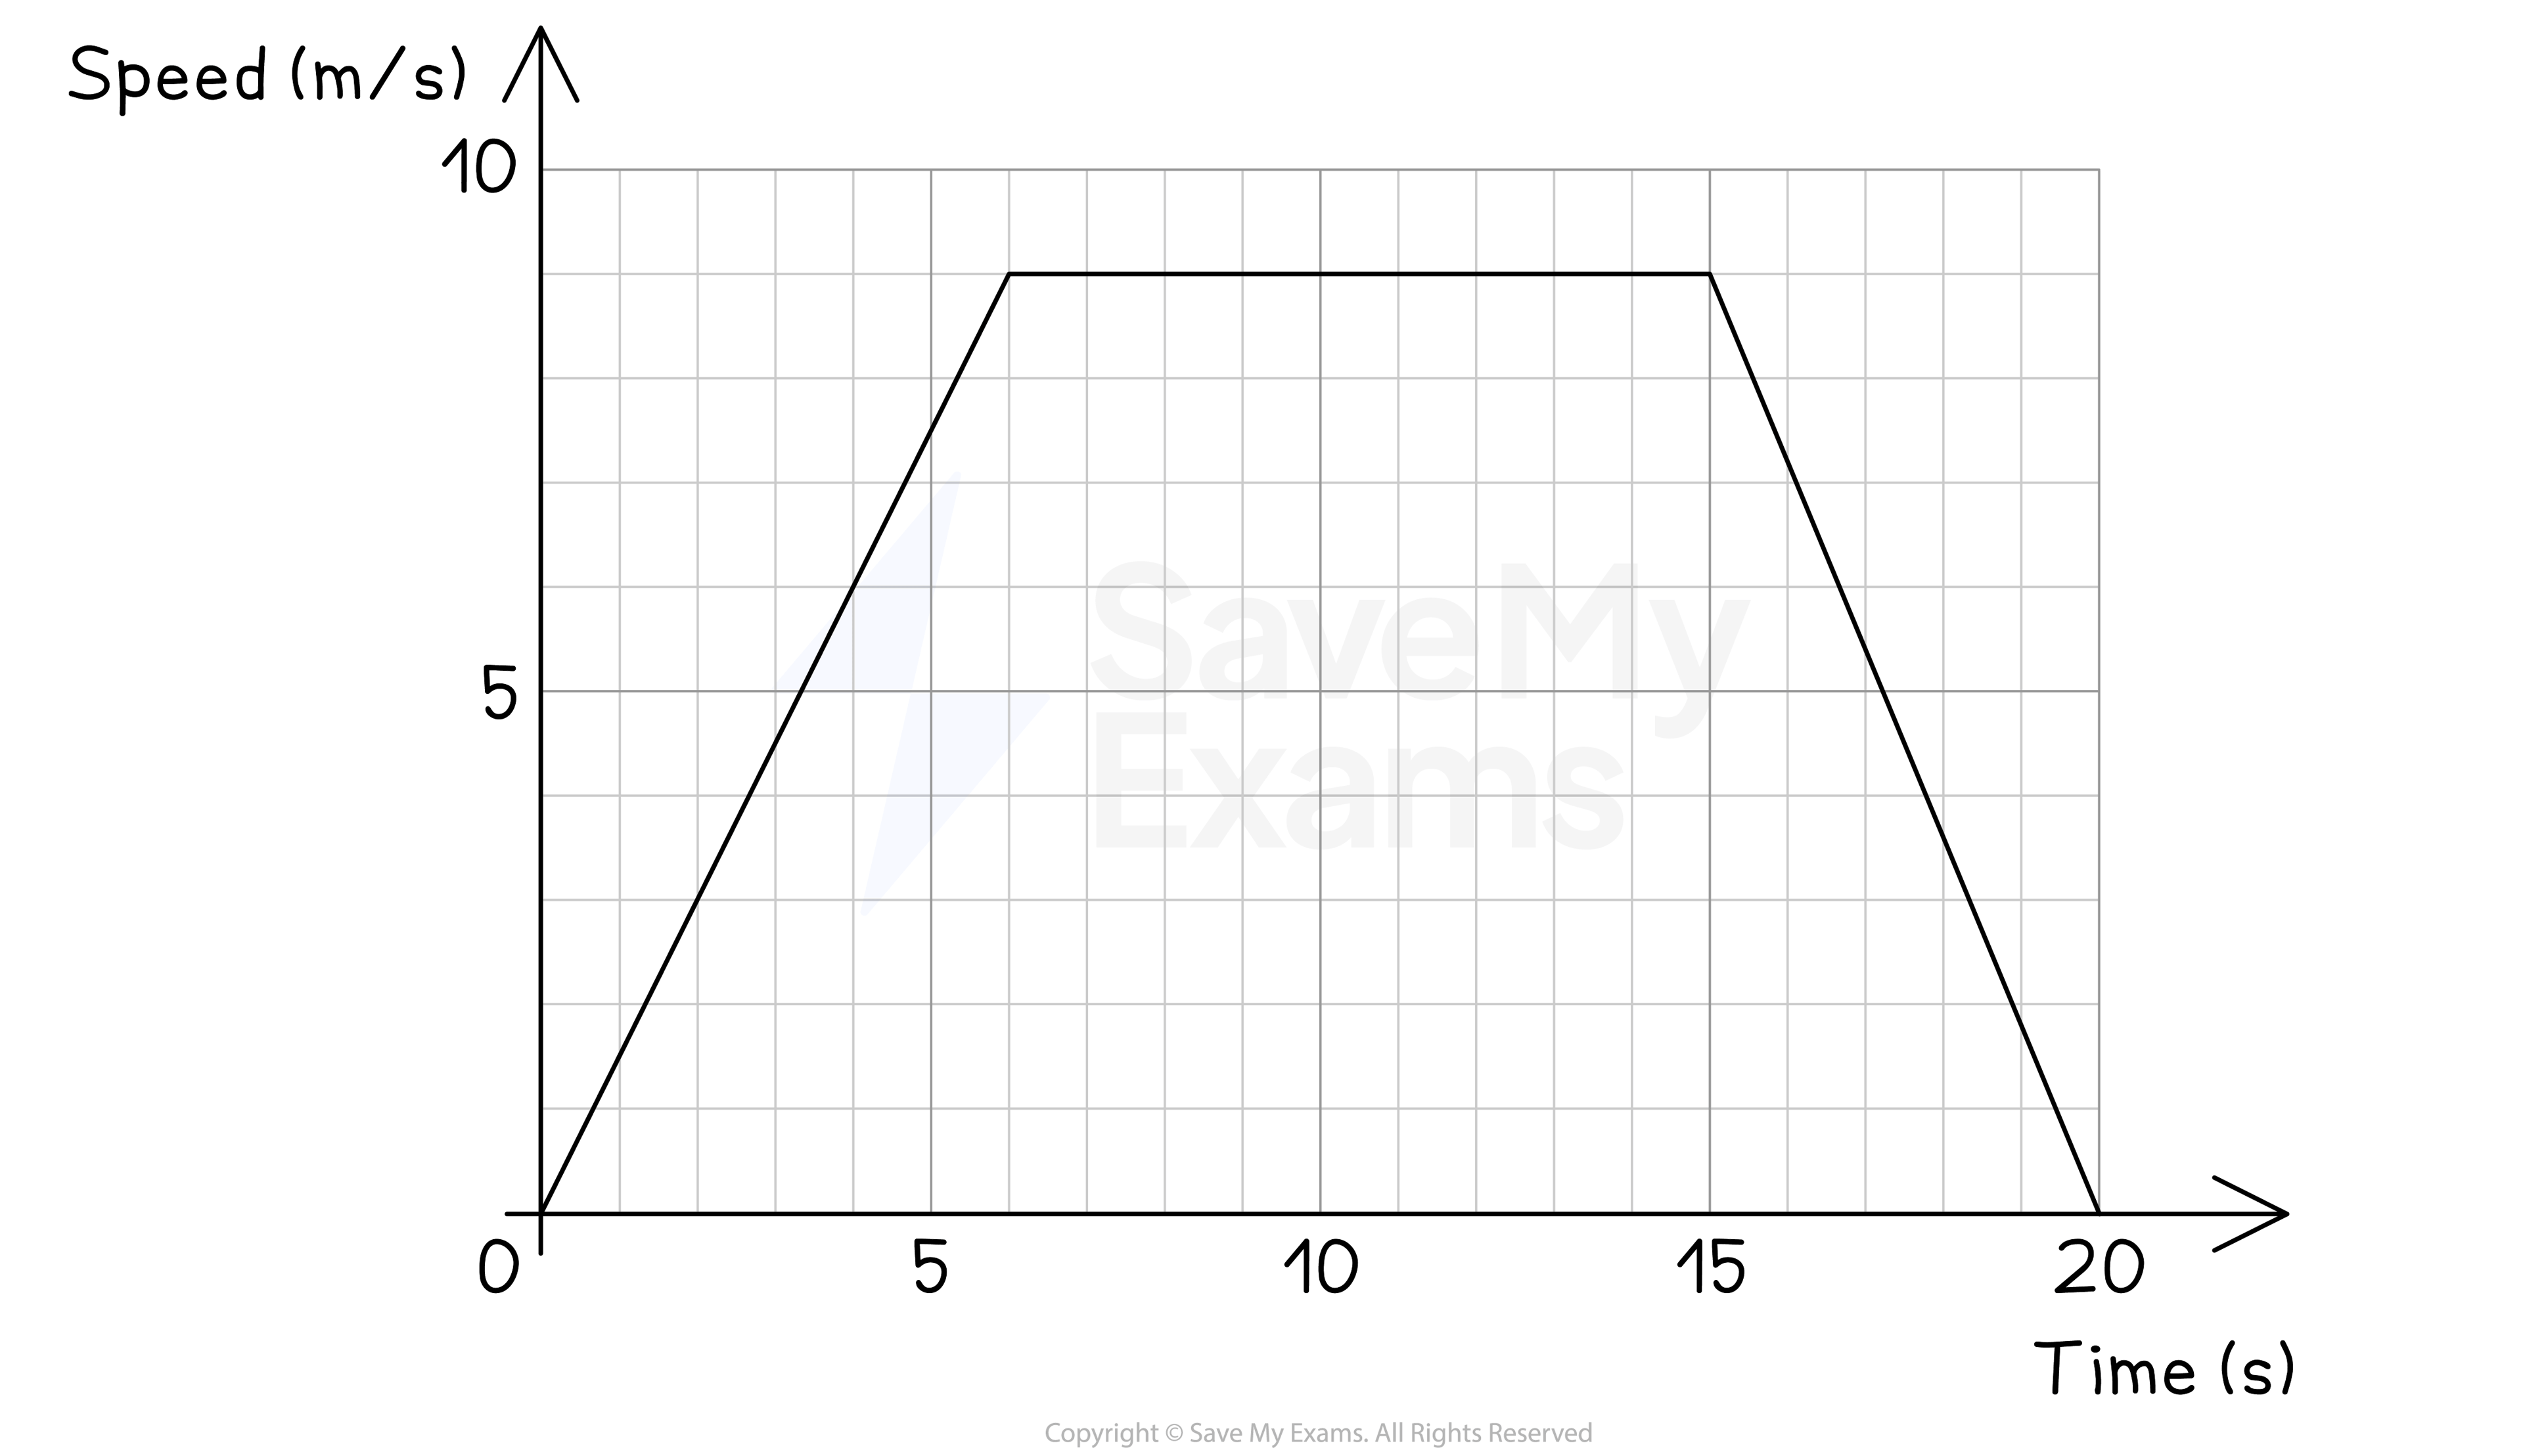
Calculate the deceleration of the car in the final 5 seconds (from t=15 to t=20).
Show answer
Deceleration is the negative acceleration, found by the gradient of the line.
- Identify the change in speed (y-axis): The speed goes from 9 m/s down to 0 m/s. The change is m/s.
- Identify the change in time (x-axis): The time goes from 15 s to 20 s. The change is s.
- Calculate the gradient:
The question asks for deceleration, which is usually stated as a positive value. The deceleration is 1.8 m/s².
Advanced Problems: Working Backwards
A common, more challenging question gives you the total distance and asks you to find a missing time or speed. This requires you to form an algebraic equation using the 'Area = Distance' rule.

Your Task:
Before looking at the solution in the image, try to solve this yourself.
- Recognise the shapes: The area under the graph can be split into a trapezium and a triangle.
- Write expressions for the area:
- Area of Trapezium (0 to 24s):
- Area of Triangle (24 to 40s):
- Form an equation: The sum of these two areas is the total distance. Crucially, check the units! The distance is given as 1.24 km, which must be converted to 1240 m.
- Solve the equation for .
Compare your method and final answer with the one provided in the image. This type of question is excellent for picking up method marks, even if you make a small calculation error.
Estimating with Curved Graphs
While most IGCSE questions involve straight lines, you may be asked to interpret curved speed-time graphs.
- Instantaneous Acceleration: The acceleration at a single point in time is found by drawing a tangent to the curve at that point and calculating its gradient.
- Estimating Distance: The distance travelled is still the area under the curve. You can estimate this by splitting the area into several trapeziums of equal width.
Velocity-Time Graphs - Area Under a Curve & Gradient of a Curve | Grade 9 Series | GCSE Maths Tutor
Let's watch a clear explanation of how to handle curves. This is a higher-level skill that sets you up for top marks and links to calculus.
Watch these two key clips: Estimating Distance (01:32 - 08:50): See how the area under a curve is estimated by splitting it into multiple trapeziums. The process is repetitive: find the area of each trapezium and add them up. Instantaneous Acceleration (17:41 - 23:29): Focus on the method for finding acceleration at a specific time. You must draw a tangent to the curve at that point and then calculate the gradient of your tangent.
Drawing tangents accurately takes practice. The key is to have your ruler just "kiss" the curve at the required point, with the gap between the line and the curve looking symmetrical on both sides of the point.
Conclusion
You've now covered the essential skills for solving kinematics problems using graphs. By remembering a few core rules, you can turn these questions into a reliable source of marks.
Key Takeaways:
- Always check the axes to determine if you have a distance-time or speed-time graph.
- For distance-time graphs, the key relationship is Gradient = Speed.
- For speed-time graphs, there are two key relationships:
- Gradient = Acceleration
- Area under graph = Distance
- For area calculations, split the graph into rectangles, triangles, and trapeziums.
- For algebraic problems, form an equation by setting the total area equal to the given total distance.
- For curved graphs, use tangents to find instantaneous rates and trapeziums to estimate area.
Preview of the Next Lesson:
In our next lesson, we move to a new module: "Geometric Transformations and Vectors". We'll start by learning how to describe and perform single geometric transformations: rotation, reflection, translation, and enlargement. This builds on what you learned about transforming function graphs, but applies the concepts to 2D shapes on a coordinate grid.