Hello! Welcome back to our series on Linux system administration.
In the last lesson, you learned how to be a "log detective," using journalctl to query the systemd journal and filter messages by service and time. This is a vital skill for diagnosing problems. However, you might have noticed that if you reboot your system, logs from before the reboot might not be available. This is because, by default, many systems store logs in a temporary, or volatile, location.
Today, we'll address that directly. This lesson focuses on making your logs permanent and watching them in real-time. These are the final core skills you'll need for effective process and service management.
By the end of this 60-minute lesson, you will be able to:
- Configure
journaldto store logs persistently across reboots. - Manage the disk space used by your logs.
- Follow logs in real-time to see events as they happen.
1. Enabling Persistent Logging
The systemd-journald service can store logs in two ways:
- Volatile: Logs are kept in memory (specifically in the
/run/log/journal/directory). They are fast but are lost when the system reboots. - Persistent: Logs are written to the disk (in the
/var/log/journal/directory). They survive reboots, creating a historical record of your system's activity.
Fedora typically enables persistent logging by default on new installations, but it's a critical concept to understand and verify. The system's behavior is controlled by a simple rule: if the /var/log/journal directory exists, journald will use it for persistent storage.
For a clear, practical explanation of how this works and how to enable it if it's not already active, please read the following guide.
How To Use journalctl to View and Manipulate systemd Logs on Linux
This article from DigitalOcean clearly explains the problem of non-persistent logs and provides the exact steps to enable persistence. It frames the topic as a common troubleshooting scenario.
Read the sections titled "3. Logs Not Persisting After Reboot" and the FAQ entry "2. How do I make logs persistent across reboots?". Focus on understanding why logs might disappear and the two methods to enable persistence: creating a directory and editing the configuration file.
Do-It-Yourself: Verify and Test Persistence
Let's apply what you just read. We will check your system's current configuration and ensure it's set for persistence.
-
Check for the Journal Directory:
First, check if the persistent log directory exists on your system.ls /var/log/journalIf this command shows a directory with a long alphanumeric name (your machine's ID), then persistent logging is likely already active. If it reports
No such file or directory, you would need to create it withsudo mkdir -p /var/log/journal. -
List System Boots:
The definitive test is to askjournalctlwhich boot sessions it has logs for.journalctl --list-bootsThe output shows one line per boot session. A
0in the first column refers to the current boot. A-1refers to the previous boot,-2the one before that, and so on. If you see more than just the current boot (0), your logs are persistent! -
The Ultimate Test (Optional but Recommended):
To see this in action, reboot your machine.sudo rebootAfter you log back in, open a terminal and run
journalctl --list-bootsagain. You should now see your previous session listed with a-1offset. You can even view its logs withjournalctl -b -1. This confirms your system is keeping a historical record.
2. Managing Log Size
With great power comes great responsibility. Storing logs forever would eventually fill up your hard drive. journald has built-in mechanisms to control how much disk space the logs are allowed to consume.
You can configure this in the file /etc/systemd/journald.conf or manually clean up old logs using journalctl itself. The following video and text provide a great overview.
LPIC 1 - 065 - 108.2 (3/3) - System Logging, master systemd-journald, journalctl and systemd-cat
This video provides a great visual walkthrough of the journald.conf file and the journalctl --vacuum-* commands for manually cleaning logs.
Watch the segment from 16:01 to 24:24. The first part (until 20:26) explains the Storage setting in journald.conf, reinforcing what you just read. The second part (from 20:26) introduces the settings for managing disk space (like SystemMaxUse) and the vacuum commands.
To summarize the key points:
- Configuration File: In
/etc/systemd/journald.conf, you can uncomment and set options likeSystemMaxUse=(e.g.,SystemMaxUse=1G) to limit the total space used by logs, orSystemKeepFree=to ensure a certain amount of disk space is always available. - Manual Cleanup (Vacuuming): You can clean up archived journal files on demand. This is useful for immediate space recovery. The main commands are:
--vacuum-size=SIZE: Deletes old logs until the total size is underSIZE(e.g.,500M).--vacuum-time=TIME: Deletes logs older thanTIME(e.g.,2dfor two days,1wfor one week).
Do-It-Yourself: Check and Clean
Let's practice managing your journal's size.
-
Check Current Disk Usage:
Find out how much space your journal logs are currently using.journalctl --disk-usage -
Perform a Cleanup:
Let's run a cleanup operation. We'll use the--vacuum-sizeoption to shrink the journal archives to a specific size. Let's aim for 500MB.sudo journalctl --vacuum-size=500MThe command will report how much space was freed.
-
Verify the Result:
Check the disk usage again to see the effect of the vacuuming operation.journalctl --disk-usageNote: The total size might still be slightly above your target because the vacuum command primarily affects archived journal files, not the active one currently being written to.
3. Following Logs in Real-Time
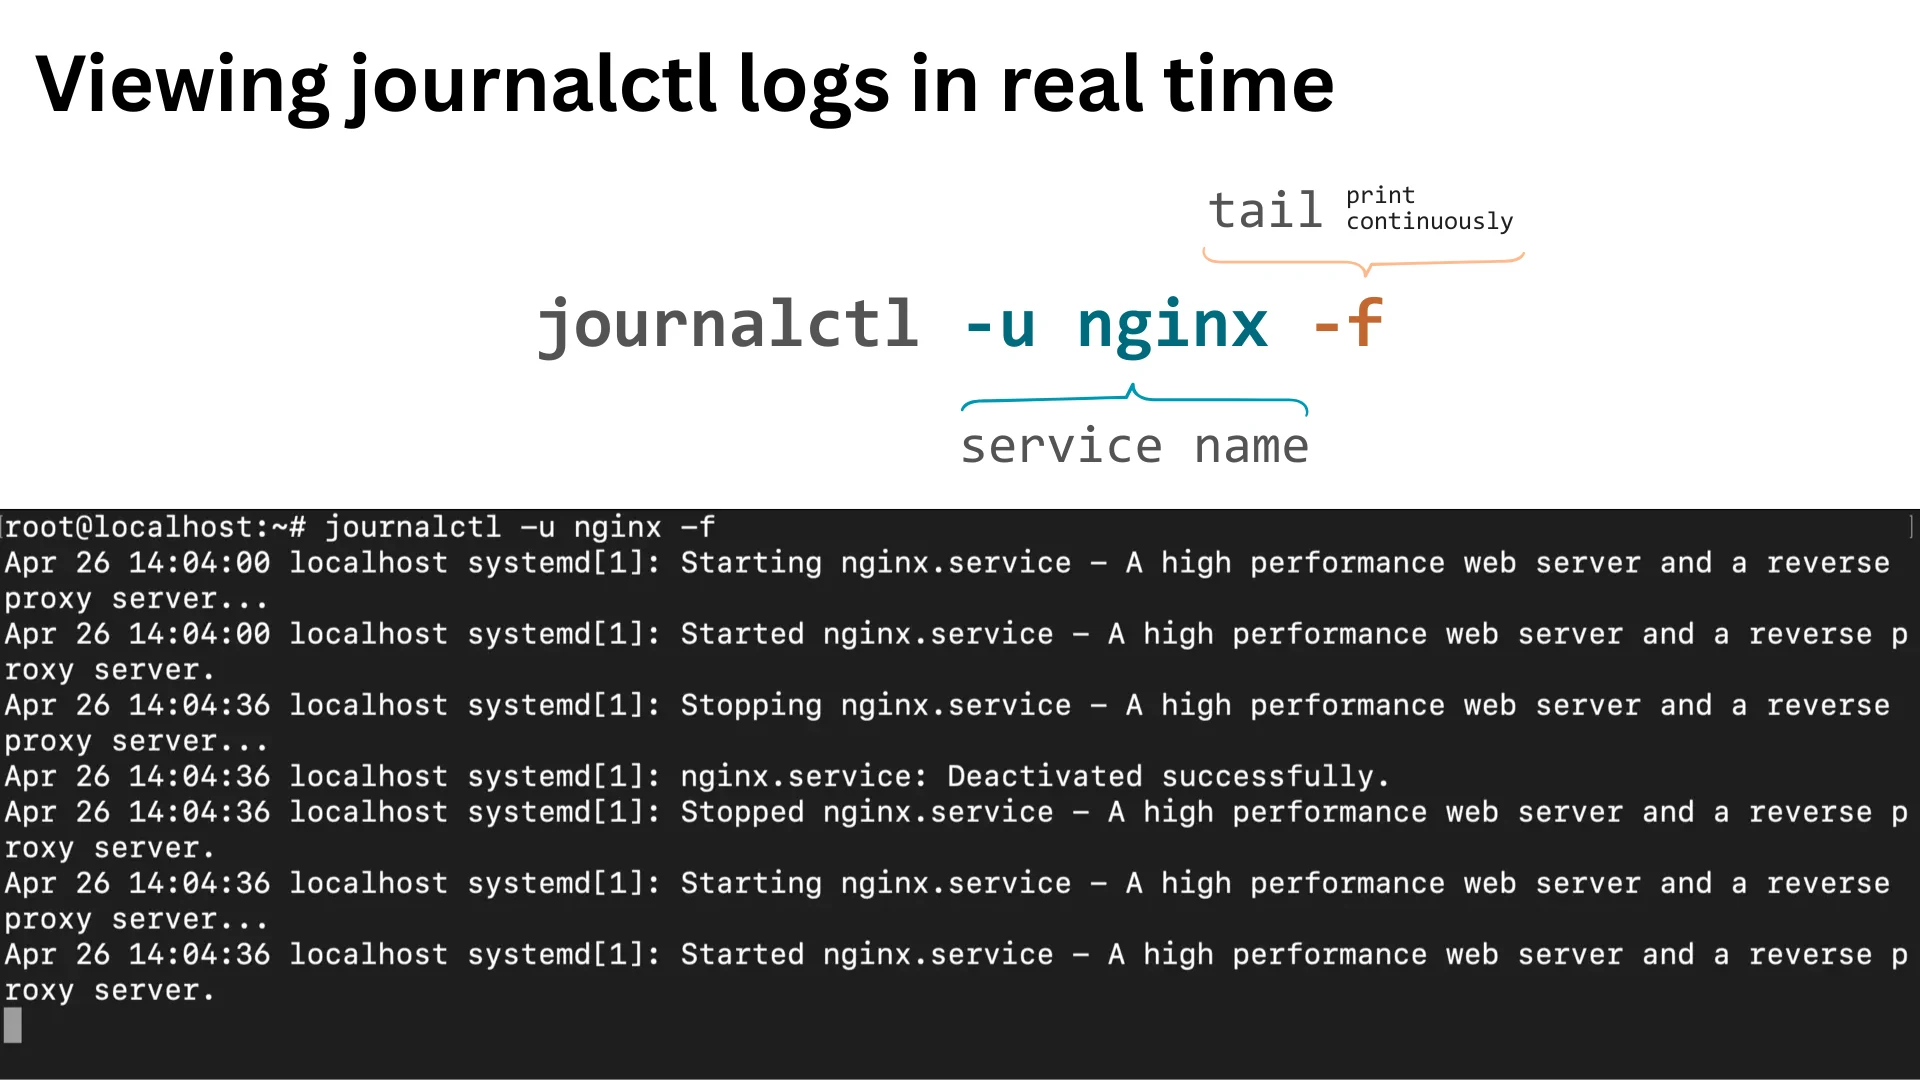
In the last lesson, we briefly mentioned the -f (or --follow) flag. Now, let's put it into a practical workflow. Following a log file is one of the most common activities when debugging a service. You get to see new log messages appear on your screen the instant they are generated.
This is best demonstrated with a real service. We'll continue using the httpd web server.
Do-It-Yourself: Live Debugging Simulation
For this exercise, I recommend opening two terminal windows and placing them side-by-side.
-
In Terminal 1 (The "Observer"):
Start following the logs for thehttpdservice. This terminal will now be your live log viewer.journalctl -f -u httpd.serviceYour cursor will wait at the end of the output.
-
In Terminal 2 (The "Actor"):
Use this terminal to issue commands that affect the service. After each command, look at Terminal 1 to see the log messages that appear.-
Stop the service:
sudo systemctl stop httpdYou should see messages in Terminal 1 indicating that
httpd.service: Succeeded.or that the service was stopped. -
Start the service again:
sudo systemctl start httpdNow you'll see startup messages appear in Terminal 1.
-
Restart the service:
sudo systemctl restart httpdYou'll see a quick sequence of stopping and starting messages.
-
-
When you're finished, go back to Terminal 1 and press
Ctrl+Cto stop following the log.
This two-terminal workflow is fundamental for system administration and development. You'll use it constantly when deploying your Django projects to see if they start correctly or to diagnose errors when a user accesses a web page.
Conclusion
Congratulations on completing this module on process and service management! You have now mastered the essential tools for controlling and observing the software running on your Fedora system.
Key Takeaways:
- Logs can be volatile (in memory, lost on reboot) or persistent (on disk, survive reboots).
- Persistent logging is enabled by ensuring the
/var/log/journaldirectory exists and restarting thesystemd-journaldservice. - You must manage the size of persistent logs, either through the
/etc/systemd/journald.conffile or with manualjournalctl --vacuum-*commands. - The
journalctl -fcommand is your tool for real-time monitoring, a crucial part of any debugging workflow.
Preview of the Next Module:
So far, we've focused on what's happening inside your machine. In our next module, "Network Configuration and Security," we'll turn our attention to how your system communicates with the outside world. You will learn how to check your IP address, test network connectivity, and configure the firewall—all critical skills for making your future web applications accessible and secure on the internet.