Hello! Welcome to the next lesson in your journey to becoming a proficient Linux system administrator for web development.
In the last lesson, you mastered the systemctl command, learning how to start, stop, enable, and disable services. This gave you control over the state of your system's processes. But what happens when a service doesn't start, or it's misbehaving? Simply restarting it isn't enough; you need to investigate the cause. That's where logging comes in.
This lesson dives into journalctl, the powerful command-line tool for querying the systemd journal. You'll learn how to find the "needle in a haystack"—the specific log messages you need to diagnose a problem. This is a fundamental troubleshooting skill you will use daily as both a system administrator and a developer.
By the end of this 60-minute lesson, you will be able to query system and service logs using journalctl, filtering by unit and time, to effectively find the information you need.
1. Understanding the systemd Journal
Before we start querying, it's important to understand what the systemd journal is. Unlike older Linux systems where logs were scattered in various plain-text files in /var/log, systemd centralizes log data from all parts of the system—the kernel, early boot processes, daemons, and applications—into a single, structured, indexed binary journal. This centralization and structure are what make journalctl so powerful.
To get a clear overview of the journalctl command and its purpose, let's start with a short video.
journalctl Basics: How to Easily Check Your Linux Logs
This video from Learn Linux TV provides an excellent introduction to what journalctl is, how it fits into a systemd-based system like Fedora, and why it's essential for viewing logs.
Watch the segment from 00:34 to 04:02. The speaker explains the role of journalctl in modern Linux distributions and its connection to systemd.
2. Filtering Logs by Service (Unit)
The most common task you'll perform with journalctl is checking the logs for a specific service. This is how you'll debug your Django application, your Nginx web server, or your PostgreSQL database.
The key to this is the -u (or --unit) flag. You provide the name of the service unit you want to inspect. Let's continue using the httpd service we worked with in the previous lesson.
First, make sure the service is running. If it's not, start it:
sudo systemctl enable --now httpd
Now, to view only the logs for the httpd service, run:
journalctl -u httpd.service
You can scroll through the entire history of logs for this service using the arrow keys, and press q to quit.
The following video segment demonstrates this concept clearly, using both httpd and sshd as examples.
journalctl Basics: How to Easily Check Your Linux Logs
Continuing with the same video, this section shows you the practical application of the -u flag to isolate logs from a specific service.
Watch the segment from 07:23 to 10:13. Pay close attention to how the command journalctl -u httpd filters the output to show only Apache-related log entries.
3. Filtering Logs by Time
Viewing all logs for a service can still be overwhelming. Usually, you're interested in events that happened within a specific timeframe—since a service was last restarted, in the last 10 minutes, or yesterday.
journalctl provides powerful time-filtering options with the --since and --until flags. You can use specific timestamps or human-readable phrases.
For a detailed look at the flexible time formats you can use, let's turn to an excellent written guide.
How To Use journalctl to View and Manipulate systemd Logs on Linux
This article from DigitalOcean provides a comprehensive overview of journalctl. We'll focus on the section that details time-based filtering.
Read the section titled "How to Filter systemd Logs by Time with journalctl". Pay special attention to the subsection "Filter journalctl Logs by Custom Date and Time Ranges". Notice the different formats you can use, like "2024-01-10 17:15:00", "yesterday", and "1 hour ago".
Combining Unit and Time Filters
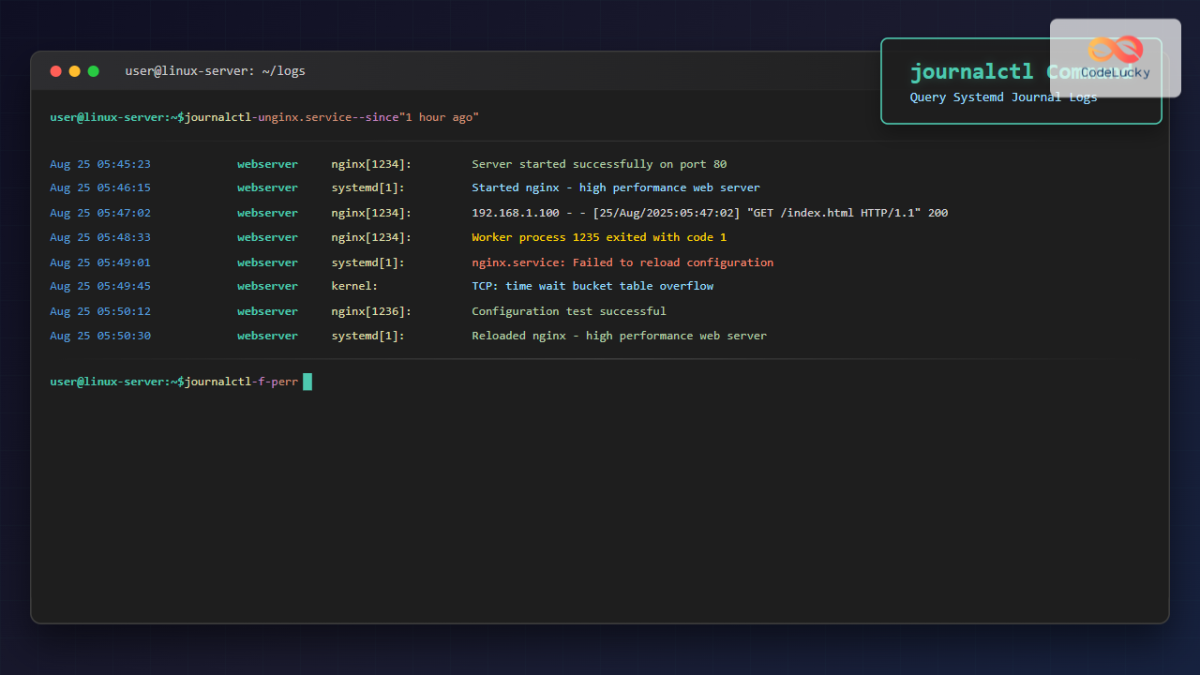
The real power comes from combining these filters. This is how you'll zero in on problems. For example, to see all logs from your web server in the last hour, you would run:
journalctl -u httpd.service --since "1 hour ago"
4. Do-It-Yourself: Investigating Service Activity
Time to put your new skills to the test. This exercise simulates a common troubleshooting scenario.
-
Create a Log Event: First, let's create a clear event in the logs. Restart your
httpdservice.sudo systemctl restart httpdThis action generates "stopping" and "starting" log entries.
-
Find the Restart Event: Now, use a combined filter to find the log entries related to the restart you just performed. Since it just happened, looking at the last minute should be sufficient.
journalctl -u httpd.service --since "1 minute ago"Can you see the lines indicating the service was stopped and then started?
-
Explore Different Timeframes:
- View all
httpdlogs from today:journalctl -u httpd.service --since "today" - View all logs for the SSH service (
sshd) from the last 15 minutes:journalctl -u sshd.service --since "15 minutes ago"
- View all
-
Find the Service Name: What if you don't know the exact service name? You can list all active services and pipe the output to
grepto find what you're looking for. For example, to find a service related to your network manager:systemctl list-units --type=service | grep -i networkOnce you find the name (e.g.,
NetworkManager.service), you can use it withjournalctl.
5. Other Essential Filtering Techniques
While filtering by unit and time is the focus of this lesson, there are a few other indispensable options you should be aware of. They will make your life as a sysadmin much easier.
Filter journalctl Logs by Service - Linux Handbook
This article from Linux Handbook provides a fantastic, concise summary of various journalctl filtering options. It's a perfect reference guide.
Read the sections "More tips on filtering journal logs by services" and the summary table. Specifically, take note of these two options: -f (Follow): How would this be useful for watching a service in real-time as you test it? -p (Priority): How could this help you quickly find only the errors and ignore informational messages?
To quickly recap what you just read:
- Following Logs (
-f): Thejournalctl -f -u httpd.servicecommand allows you to watch the logs for thehttpdservice in real-time. New entries will appear in your terminal as they are generated. This is incredibly useful for live debugging. To exit, pressCtrl+C. - Filtering by Priority (
-p): You can filter messages by their severity. For example,journalctl -p err -bwill show you all messages from the current boot session that are classified as an error (err), critical (crit), alert (alert), or emergency (emerg). This helps you cut through the noise and focus on what's broken.
Conclusion
Great job! You've taken a significant step in developing your diagnostic skills. You've learned that systemd provides a centralized journal and that journalctl is your window into it. Most importantly, you now have the practical ability to query this journal effectively.
Key Takeaways:
journalctlis the command used to read from thesystemdjournal.- Use
journalctl -u <service_name>to filter logs for a specific service. - Use
journalctl --since "time"andjournalctl --until "time"to narrow your search to a specific period. - Combining unit and time filters is the most powerful way to find relevant log entries.
- Flags like
-f(follow) and-p(priority) provide additional powerful ways to interact with your logs.
In this lesson, we've focused on querying existing logs. But how does the system decide which logs to keep and for how long? In our next session, we'll look at configuring journald for persistent logging to ensure your logs survive a reboot, and we'll explore real-time log following in more depth.