Hello! Welcome to your next lesson on Linux system administration.
In our last session, we mastered dig, a tool that acts like the internet's address book, allowing us to query remote servers and troubleshoot DNS issues. You learned how to confirm where a domain name points, an essential step before trying to connect to a service.
Today, we're bringing our focus back from the remote server to your own local machine. Once you start a web server for your Django project, how do you verify it's actually running and ready to accept connections? How do you solve the dreaded "port already in use" error? This is where our next tool comes in.
This lesson addresses the learning outcome: Identify listening ports and active network connections using ss. The ss (socket statistics) command is your local network scanner, giving you a real-time view of all network activity on your Fedora system. For a developer, this is a non-negotiable skill for debugging applications, verifying deployments, and performing basic security checks.
1. What is a Listening Port?
Before we dive into the command, let's clarify what we're looking for.
How to Check for Listening Ports in Linux (Ports in use)
The article "How to Check for Listening Ports in Linux" from Linuxize gives a perfect, concise definition of a listening port. Understanding this concept is the foundation for this lesson.
Read the introductory section titled "What is a Listening Port".
The key takeaway is that a listening port is a communication endpoint where a process (like a web server) is waiting for incoming connections. Crucially, only one process can listen on the same IP address and port at any given time. This is why you can't run two Django development servers on port 8000 simultaneously.
2. Finding Listening Ports with ss
The ss command is the modern, fast, and detailed tool for inspecting network sockets, replacing the older netstat utility.
Let's watch a short video that introduces the most common and powerful combination of options for finding listening services.
How to Use SS to Monitor Listening Ports on Your System
This video from Red Hat, "How to Use SS to Monitor Listening Ports on Your System", demonstrates the exact command you'll use most often.
Watch from 00:55 to 02:32. Pay close attention to the breakdown of the ss -tuln options and how adding the -p flag reveals which process is using the port.
The command you just saw, sudo ss -tunlp, is your primary tool. Let's break it down:
sudo: Required to see process information (-p) for services run by other users or the system itself.-t: Show TCP sockets.-u: Show UDP sockets.-n: Show numeric addresses and port numbers. This is faster and often clearer than trying to resolve names.-l: Show only listening sockets.-p: Show the process (program name and PID) using the socket.
When you run sudo ss -tunlp, the output will look something like this:

The most important columns are:
- State: Should be
LISTEN, since we used the-lflag. - Local Address:Port: The IP address and port the service is listening on.
0.0.0.0means it's listening on all available IPv4 addresses, while[::]means all available IPv6 addresses.127.0.0.1means it's only listening for connections from the local machine. - Users: The name and Process ID (PID) of the program listening on that port. This is the answer to "What's using that port?".
3. Identifying Active (Established) Connections
Finding what's listening is half the story. The other half is seeing who is currently connected. A listening socket is waiting for a knock on the door; an established connection is an active conversation happening right now.
To see active connections, we simply remove the -l (listening) flag and filter by the ESTABLISHED state.
ss -tn state established
The output will look different. Notice the Peer Address:Port column, which shows the remote end of the connection.
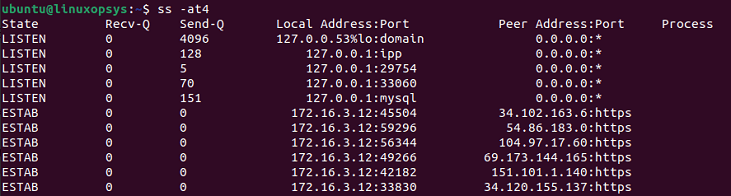
In this image, you can see services LISTENing on ports like domain (53), ipp (631), and mysql (3306). You can also see several ESTABlished connections for https (port 443), showing active web browsing traffic.
You can also filter by protocol and IP version.
How to Use the ss Command (Linux Crash Course Series)
The video "How to Use the ss Command" by Learn Linux TV provides a clear walkthrough of how to filter for different connection types.
Watch from 02:50 to 03:35 and from 04:30 to 05:05. This covers filtering for TCP (-t), UDP (-u), IPv4 (-4), and IPv6 (-6) sockets.
4. A Quick Note: ss vs. netstat
You will frequently encounter an older command, netstat, in online tutorials and articles. While it performs a similar function, ss is now the standard on modern Linux systems like Fedora.
Beyond the Basics: Understanding Socket Statistics
It's helpful to know why the switch was made. This article from Webdock provides a concise comparison.
Read the section "Socket Statistic vs. Netstat" to understand the pros and cons of each tool.
In short, ss is faster and gets its information directly from the kernel, while netstat is considered obsolete. You should use ss, but now you'll know what netstat is when you see it.
5. Do-It-Yourself: Network Detective Work
Time to put this into practice. Open your terminal and follow along.
Task 1: Audit Your System
Run sudo ss -tunlp on your Fedora machine.
- Can you find the SSH service (
sshd) listening on port 22? - Do you see any other services you recognize? (You might see
cupsdfor printing, orsystemd-resolvefor DNS).
Task 2: Simulate Your Web Server
This exercise simulates the most common use case for ss in web development: checking if your server started correctly.
- In your terminal, start a simple Python web server. This command is built into Python and is perfect for quick tests.
python3 -m http.server 8000 - Your terminal will now be occupied by the web server. Open a new terminal window or tab.
- In the new terminal, use
ssto check if your server is listening on port 8000. It's better to use the built-in filter thangrep.
You should see an output line showing that asudo ss -tlnp sport = :8000python3process is listening on port 8000. - Go back to the first terminal and stop the server with
Ctrl+C. - Run the
sscommand from step 3 again. The output should now be empty. You've just confirmed your server has stopped.
Task 3: Troubleshoot a "Port in Use" Error
This is another critical real-world scenario.
- Start the Python web server again in one terminal:
python3 -m http.server 8000. - Open a second terminal and try to start another server on the same port:
python3 -m http.server 8000. - You will get an error:
OSError: [Errno 98] Address already in use. - Your task is to play detective. Use the
sscommand you learned in Task 2 to identify the process (and its PID) that is already using port 8000.
Task 4: View an Active Connection
Let's see the difference between LISTEN and ESTABLISHED.
- Make sure your Python web server is running on port 8000.
- Open your web browser and navigate to
http://127.0.0.1:8000. You should see a simple directory listing. - Now, in your terminal, run the following command to see all connections related to port 8000:
ss -tn '( dport = :8000 or sport = :8000 )' - You should now see at least two lines: one in the
LISTENstate (your server waiting) and one or more in theESTABLISHEDstate (the active connection from your browser).
Conclusion
Fantastic work! You now have the ability to inspect the network activity on your own machine. This is an indispensable skill for any developer or system administrator. When your application fails to start or becomes unreachable, ss is one of the first tools you should reach for.
Key Takeaways:
ssis the modern command-line tool for displaying socket statistics on Linux.- The command
sudo ss -tunlpis your go-to for a quick and comprehensive list of all listening services and the processes that own them. - You can distinguish between sockets in a
LISTENstate (waiting for a connection) and anESTABLISHEDstate (actively communicating). - Using
ssis the standard way to troubleshoot "address already in use" errors by identifying which process is occupying a specific port.
You've learned how to check remote services with tools like ping and dig, and now you can verify services running locally with ss. But just because a service is listening doesn't mean it's accessible from the outside world. That's controlled by the firewall.
In our next lesson, we will explore the final piece of this networking puzzle: firewalld. You will learn the basics of firewall zones and how to open ports to allow legitimate traffic (like for your web server) to reach your applications.