Introduction
In our last lesson, you mastered the mathematical derivation of a spot rate curve from an idealized par-yield curve. This gave you a solid grasp of the recursive logic at the heart of bootstrapping: using known, shorter-term spot rates to solve for the next, longer-term spot rate in the sequence.
Today, we will translate that theoretical understanding into practice. Your objective is to implement the bootstrapping algorithm in Python to construct a spot rate curve not from a perfect par curve, but from real market data—a collection of bonds with varying coupons, maturities, and market prices. This will equip you with a core skill for practical fixed-income analysis.
1. The Bootstrapping Process with Market Bonds
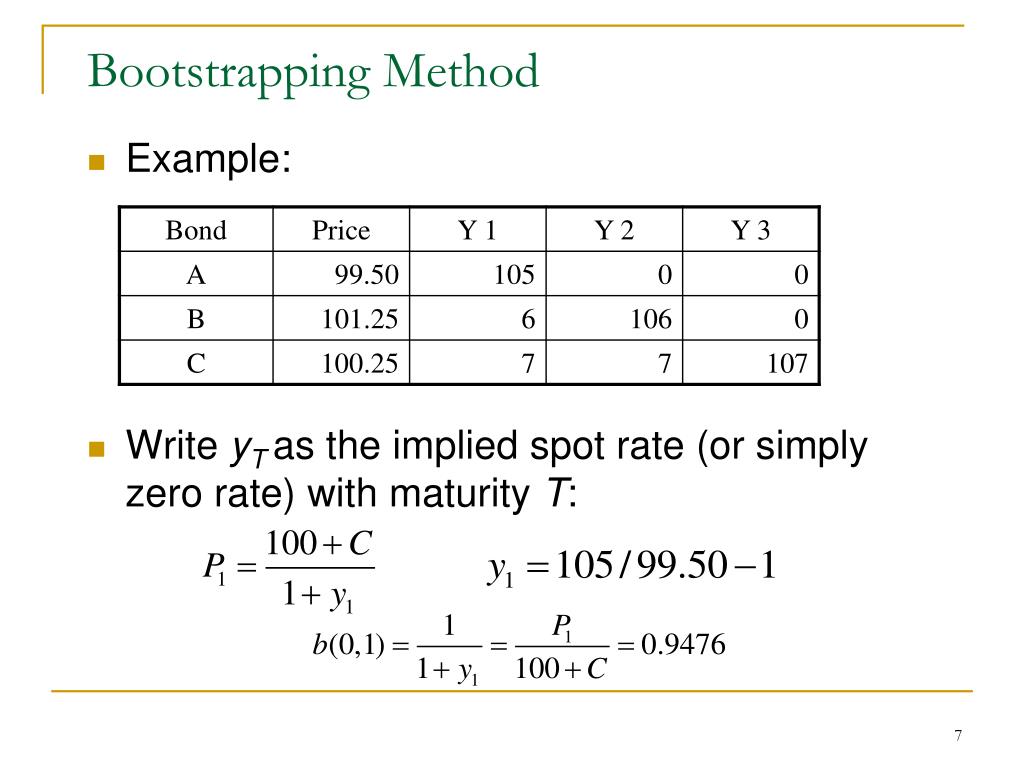
The fundamental logic of bootstrapping remains unchanged when moving from a theoretical par curve to a set of actual market bonds. However, instead of assuming all bonds are priced at par (100), we now use their observable market prices.
The process involves selecting a set of bonds of the same credit quality (e.g., government bonds) with staggered maturities. We then extract the spot rates one by one, moving from the shortest maturity to the longest. The video below provides an excellent high-level overview of this iterative process.
ep11: Yield curves - par curves, spot curves, bootstrapping...simple explanation
This video, "ep11: Yield curves - par curves, spot curves, bootstrapping...simple explanation," offers a great conceptual walkthrough of building a spot curve from coupon-paying bonds.
Focus on the segment covering the bootstrapping process. The presenter illustrates how to start with a one-period bond and iteratively solve for the two-period spot rate, then the three-period spot rate, and so on. Notice how the logic is identical to what we did with the par curve, but now we can use any set of coupon bonds.
As the video shows, the core task for each bond is to solve for the one unknown spot rate corresponding to its final cash flow, using its market price and the spot rates we've already derived from shorter-maturity bonds.
2. The Bootstrapping Algorithm
Let's formalize the algorithm for a bond with periods to maturity and a market price . Assuming semi-annual payments (so payments per year) and a face value of , its price is the sum of its discounted cash flows:
At each step, we have a bond whose final cash flow corresponds to the spot rate we want to find. All prior spot rates are known. We can rearrange the equation to solve for the unknown spot rate, , where is the number of periods:
The term is the present value of all coupons before maturity, discounted using the spot rates we've already calculated. Let's call this . The equation simplifies to:
Solving for gives us the formula we'll implement:
This is the engine of our Python implementation.
3. A Practical Implementation Guide
The following article provides a superb, in-depth guide to implementing this algorithm using real US Treasury bond data. It covers not only the core formula but also practical considerations like data collection.
Computing Risk Free Rates and Excess Returns Part 2
This article from LSEG walks through the entire process of bootstrapping a spot curve from sovereign bonds.
Please read the following sections: Bootstrapping and Spot-Rates/Discount-Factors: Start here to see the mathematical formulation. The formula for \widehat{{SR}_{{Bond}_t, \mathtt{T}}} is exactly what we derived above, just with different notation. Python Function Spot_Rate_Last: Study this function. It's a direct implementation of the formula to find the next spot rate in the sequence, given a list of previously found rates (sr). Example with US Treasury Bonds: Read through this section to understand a critical real-world problem: lack of liquidity. Notice how the author solves this by combining "on-the-run" (newly issued) and "off-the-run" (older) bonds to get a full set of maturities. The final code block in this section shows the iterative loop that calls the Spot_Rate_Last function to build the complete list of spot_rates.
4. Implementing the Bootstrapper in Python
Now, let's synthesize this logic into a complete Python function. We will take a list of bonds, where each bond is represented by its maturity, market price, and coupon rate. The function will return the bootstrapped spot curve.
For this example, we'll use a simplified set of semi-annual coupon bonds with a face value of 100. The input data is sorted by maturity.
import math

def bootstrap_spot_curve(bonds):
    """
    Bootstraps a spot rate curve from a list of bonds.

    Args:
        bonds (list of dicts): A list of bond data, where each dict has
                              'maturity' (in years), 'price' (market price),
                              and 'coupon' (annual coupon rate).
                              Bonds must be sorted by maturity.

    Returns:
        dict: A dictionary mapping maturities to their corresponding spot rates.
    """
    spot_curve = {}
    face_value = 100.0

    for bond in bonds:
        maturity = bond['maturity']
        price = bond['price']
        coupon_rate = bond['coupon']


        # Calculate the semi-annual coupon payment
        coupon_payment = face_value * coupon_rate / 2.0


        # Calculate the number of periods (semi-annual)
        num_periods = int(maturity * 2)


        # --- Calculate PV of known coupons ---
        pv_coupons = 0.0
        for t in range(1, num_periods):


            # t/2 gives the maturity in years for the t-th period
            # For example, for a 2-year bond, period t=1 is at 0.5 years, t=2 is at 1.0 year etc.
            t_maturity = t / 2.0
            if t_maturity in spot_curve:
                spot_rate = spot_curve[t_maturity]


                # Discount the coupon payment for period t
                pv_coupons += coupon_payment / ((1 + spot_rate / 2.0) ** t)


        # --- Solve for the unknown spot rate ---
        # The numerator is the final cash flow (last coupon + face value)
        final_cash_flow = face_value + coupon_payment


        # The denominator is the bond's price minus the PV of intermediate coupons
        denominator = price - pv_coupons


        # This is the direct implementation of our formula
        # ( (final_cf / denominator) ^ (1/T) ) - 1
        semi_annual_spot = (final_cash_flow / denominator) ** (1 / num_periods) - 1


        # Annualize the spot rate
        annual_spot_rate = semi_annual_spot * 2

        spot_curve[maturity] = annual_spot_rate

    return spot_curve


```grasp
{
  "type": "exercise",
  "id": "a8ef3717-30e4-449b-b932-075e828fcd20"
}
--- Example Usage ---
Market data for semi-annual coupon bonds (Face Value = 100)
Data adapted from examples, ensuring prices reflect realistic yields.
market_bonds = [
{'maturity': 0.5, 'coupon': 0.00, 'price': 99.50}, # 6-month T-Bill (zero coupon)
{'maturity': 1.0, 'coupon': 0.02, 'price': 99.80}, # 1-year note
{'maturity': 1.5, 'coupon': 0.025, 'price': 99.75}, # 1.5-year note
{'maturity': 2.0, 'coupon': 0.028, 'price': 99.60} # 2-year note
]
Build the spot curve
bootstrapped_curve = bootstrap_spot_curve(market_bonds)
Print the results
print("Bootstrapped Spot Curve:")
for maturity, rate in bootstrapped_curve.items():
print(f"Maturity: {maturity:<4} years | Spot Rate: {rate:.4%}")
**Code Walkthrough:**

1.  **Initialization:** The function iterates through a list of bonds, which must be pre-sorted by maturity.
2.  **PV of Known Coupons:** For each bond, it first calculates the present value (`pv_coupons`) of all its coupons *except the last one*. It does this by looping through the previous periods and discounting each coupon using the spot rates we've already calculated and stored in the `spot_curve` dictionary.
3.  **Solving for the Spot Rate:** It then applies the formula we derived. The `denominator` (`price - pv_coupons`) is the portion of the bond's price that must be attributed to its final cash flow. The calculation solves for the semi-annual spot rate needed to discount that final cash flow to this value.
4.  **Storing the Result:** The calculated annual spot rate is stored in the `spot_curve` dictionary with its maturity as the key, making it available for the next iteration.

For a complete, file-based example of a bootstrapping implementation, you can refer to the `spot_rate_bootstrap.py` file in this GitHub repository.

```grasp
{
  "type": "reading",
  "title": "wrcarpenter/Z-Spread GitHub Repository",
  "id": "[LINK](https://github.com/wrcarpenter/Z-Spread)",
  "url": "https://github.com/wrcarpenter/Z-Spread",
  "relevant_section_indices": [
    0
  ],
  "par_intro": "This repository provides Python methods for various fixed-income analytics.",
  "par_directions": "Follow the link to the `spot_rate_bootstrap.py` file. You don't need to dive deep into every line, but observe how the code is structured to read bond data and iteratively compute the spot curve, similar to our function above. This is a good example of how such a tool would be structured in a larger project.",
  "estimated_time": "5 minutes"
}

Conclusion
You have now successfully bridged the gap from mathematical theory to practical Python code. By implementing the bootstrapping algorithm, you've created a powerful tool to extract the fundamental term structure of interest rates from observable market prices.
Key Takeaways:
- Real-World Adaptation: Bootstrapping with market data uses the same iterative logic as with a par curve, but substitutes bond market prices for the assumption of a par price.
- Sequential Calculation: The Python implementation mirrors the mathematical recursion. You must solve for spot rates in ascending order of maturity, as each calculation depends on the previous ones.
- The Core Formula: The key to the code is isolating the present value of the final cash flow and solving for the discount rate that equates it to the bond's price minus the present value of its other known cash flows.
- Practical Data Needs: Building a reliable spot curve requires a set of liquid bonds with staggered maturities, often necessitating the use of both on-the-run and off-the-run issues.
In our next lesson, we will address a key limitation of our current output. The bootstrapping process gives us a discrete set of spot rates for specific maturities (0.5, 1.0, 1.5 years, etc.). But what is the spot rate for 1.25 years? We will explore interpolation techniques to create a continuous yield curve from our bootstrapped points.