Hello and welcome to a new module!
In our previous lessons, we honed our skills in managing a single Linux system, culminating in learning how to apply critical updates to keep it secure and stable. We've mastered looking inside the box. Now, it's time to look at how that box communicates with the rest of the world. This module, "Practical Network Analysis," will be your bridge from system administration to network engineering.
Today's lesson addresses a fundamental networking scenario: capturing and analyzing a basic web request using tcpdump or Wireshark to identify the roles of Ethernet, IP, TCP, and DNS. Understanding this process is the key to diagnosing a vast range of "the internet is broken" problems. We'll use a practice-first approach, capturing live traffic and then dissecting it to understand the theory behind what we see.
1. The Journey of a Web Request
Before we capture any data, let's sketch a quick map of the journey. When you type http://example.com into your browser and hit Enter, a rapid and complex sequence of events unfolds. In essence:
- DNS Lookup: Your computer doesn't know where
example.comis. It asks a Domain Name System (DNS) server, "What's the IP address forexample.com?" The DNS server replies with an IP address (e.g.,93.184.216.34). - TCP Handshake: Your computer now knows the destination IP. To ensure reliable communication for the web page data, it uses the Transmission Control Protocol (TCP) to establish a connection. It sends a "SYN" packet to the server, which responds with "SYN-ACK," and your computer finishes with an "ACK." This is the famous three-way handshake.
- HTTP Request: With the connection established, your browser sends an HTTP
GETrequest over the TCP connection, asking the server to send the web page content. - IP and Ethernet Encapsulation: Throughout this process, every piece of data (the DNS query, the TCP handshake packets, the HTTP request) is wrapped in successive layers. The TCP segments are placed inside IP packets, which provide the source and destination IP addresses for routing across the internet. These IP packets are then placed inside Ethernet frames, which use MAC addresses for delivery on the local network.
This entire sequence is what we're about to capture and visualize.
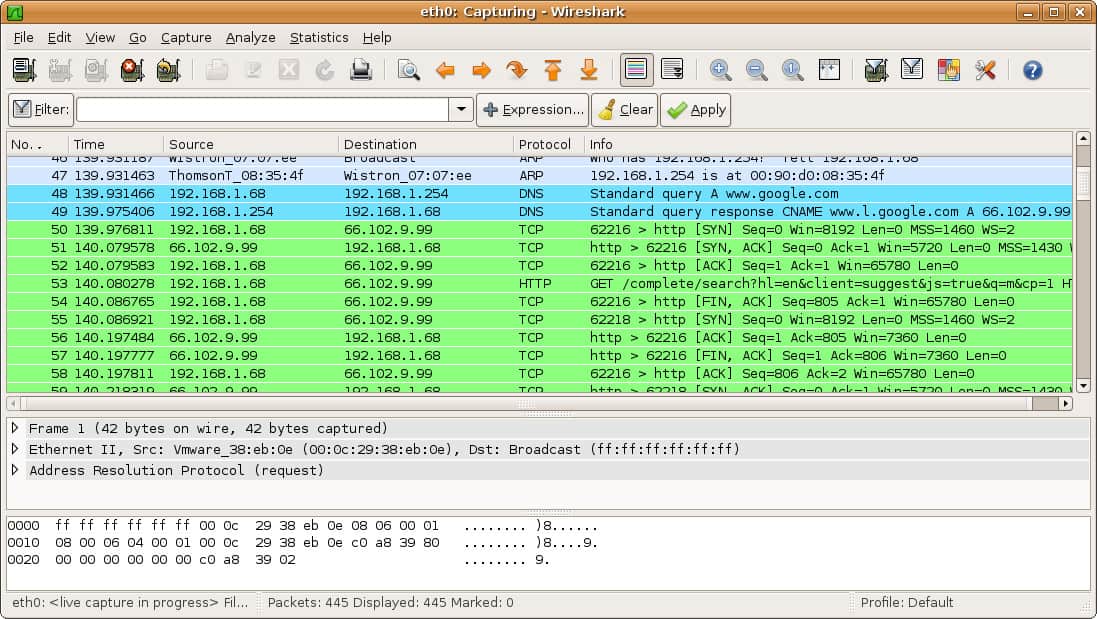
2. Capturing Traffic with tcpdump
Our first tool is tcpdump, a powerful command-line packet analyzer. It's essential because in a data center, you will often only have SSH access to a server with no graphical interface.
We'll follow a hands-on lab exercise to capture our first web request. This lab is designed for a SIFT Workstation VM, but the commands are standard and will work on your Ubuntu VM. Just be sure to substitute the network interface name if yours is different from ens33. You can find your interface name by running ip addr.
Bonus Lab 1.0: tcpdump and Wireshark Hands-On
The web page "tcpdump and Wireshark Hands-On" from SANS FOR572 provides a perfect practical exercise. We will use it to capture traffic and save it for analysis.
Follow the instructions in the sections "Observe Traffic with tcpdump" and "Write Packets to pcap File". Perform the following steps in your Ubuntu VM terminal: Open a terminal and run ip addr to identify your primary network interface name (e.g., ens33, eth0). Run the command to capture traffic, but save it to a file: sudo tcpdump -n -i <your_interface> -s 0 -w ~/webrequest.pcap. Open a web browser inside your VM and visit http://capture.for572.com. Go back to your terminal and press Ctrl+C to stop the capture.
You have now created a file named webrequest.pcap in your home directory. This file contains a recording of all the network traffic that occurred while you loaded the webpage. This workflow—capturing with tcpdump on a server and then analyzing the file—is extremely common.
For a deeper dive into the power of tcpdump, especially its filtering capabilities, the following video is an excellent resource.
tcpdump - Traffic Capture & Analysis
The video "tcpdump - Traffic Capture & Analysis" by HackerSploit provides a fantastic tour of tcpdump's features. We'll focus on how to save traffic to a file, which you just did.
Watch the segment from 18:48 to 20:30. The presenter demonstrates the -w flag to write captured packets to a .pcap file, the exact technique we used in our exercise. This reinforces the core skill of separating capture from analysis.
3. Analyzing the Capture with Wireshark
Now we'll use Wireshark, a graphical tool that excels at deep packet analysis. We will open the webrequest.pcap file you just created to dissect our web request.
First, let's get familiar with the Wireshark interface.
Mastering Wireshark: The Complete Tutorial!
The video "Mastering Wireshark: The Complete Tutorial!" from Hacker Joe is an extensive guide. We'll start with a quick tour of the interface and how to apply filters, which are essential for navigating captures.
Please watch the following segments: Introduction (00:00 - 02:24): Get a high-level overview of what Wireshark is and what it can do. Interface Tour (04:12 - 07:17): Pay close attention to the five main parts of the interface: the menu/toolbars, the display filter bar, the packet list, the packet details, and the packet bytes panes. Filtering (10:31 - 12:45): Understand the difference between capture and display filters. We will be using display filters heavily.
Now, open Wireshark on your VM, go to File > Open, and select the webrequest.pcap file from your home directory. Let's start our analysis.
Step 1: The DNS Query (Resolving the Name)
The first thing the browser needed to do was find the IP address for capture.for572.com.
In Wireshark's display filter bar at the top, type dns and press Enter. You should see a much shorter list of packets.
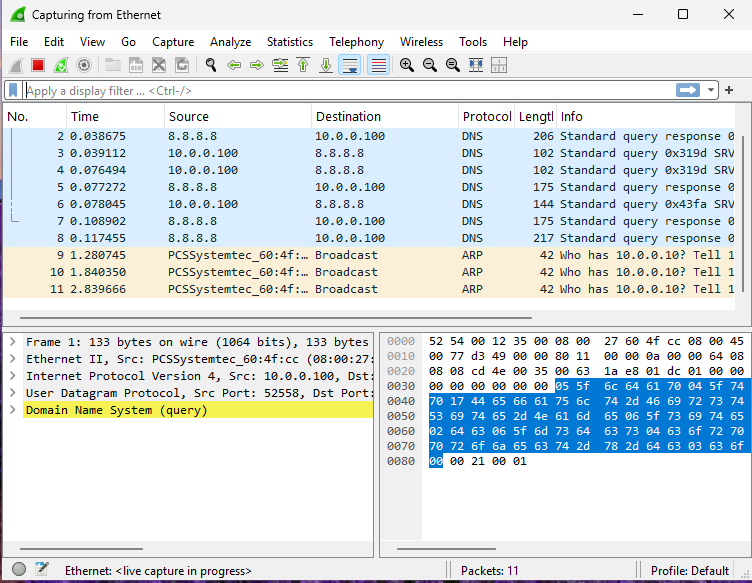
Look for a "Standard query" for the hostname you visited. Select it. In the packet details pane below, you can expand the "Domain Name System (query)" section to see the exact question your computer asked. Now, find the "Standard query response" and see the IP address it provided in the "Answers" section.
- Role of DNS: To translate human-readable domain names (
capture.for572.com) into machine-readable IP addresses. It acts as the phonebook of the internet. It typically uses the User Datagram Protocol (UDP) at Layer 4 for speed.
This article provides a clear, step-by-step walkthrough of analyzing DNS traffic, just as we have done.
Analyzing Network Packets with Wireshark - Medium
The article "Analyzing Network Packets with Wireshark" on Medium gives a great play-by-play of an investigation. We will refer to the section on DNS analysis.
Read "Step 5: DNS Traffic Analysis". Notice how the author filters for udp.port == 53 (the standard DNS port) and inspects the 'Queries' and 'Answers' sections, confirming the link between the domain name and the resolved IP address.
Step 2: The TCP Connection (Opening the Line)
Clear the dns filter. Now, let's watch the TCP handshake. In the filter bar, type tcp.port == 80 to see only traffic destined for the standard HTTP port.
You should see three packets at the beginning of the conversation that stand out:
- A packet from your machine to the server with the
[SYN]flag set. - A packet from the server back to you with the
[SYN, ACK]flags set. - A final packet from your machine to the server with the
[ACK]flag set.
This is the three-way handshake.
- Role of TCP: To provide a reliable, connection-oriented communication channel. It ensures that data arrives in order and without errors before the actual HTTP data is sent.
The video below demonstrates this handshake in action.
Mastering Wireshark: The Complete Tutorial!
Let's return to the "Mastering Wireshark" video to see a demonstration of the TCP handshake and the powerful 'Follow Stream' feature.
Watch from 42:46 to 44:55. This clip shows: The [SYN], [SYN, ACK], [ACK] sequence of the three-way handshake. How to right-click a packet and select Follow > TCP Stream to reassemble the entire conversation into a readable format.
Try this yourself: right-click on one of the HTTP packets in your capture and select Follow > TCP Stream. A new window will pop up showing the raw HTTP conversation. You can see the GET request sent by your browser (in blue text) and the HTML code of the webpage sent back by the server (in red text).
Step 3: The Underlying Layers (The Envelopes)
Close the "Follow Stream" window and select any packet from the HTTP conversation (like the GET request). Now look closely at the packet details pane. This is where we see the roles of IP and Ethernet.
The article from Medium provides an excellent breakdown of this view.
Analyzing Network Packets with Wireshark - Medium
Let's refer back to the Medium article "Analyzing Network Packets with Wireshark" for a layer-by-layer breakdown.
Read "Step 3: Deep Packet Inspection (Layer by Layer)". The author inspects a single TCP packet and explains what each layer represents. Use this as a guide to inspect your own packet.
As you inspect your packet, identify these layers:
- Layer 4: Transmission Control Protocol (TCP): You'll see the source and destination ports (e.g., a random high port from your machine to port 80 on the server). This ensures the data gets to the correct application (the web server).
- Layer 3: Internet Protocol (IP): You'll see the source and destination IP addresses. This is the "mailing address" used for routing the packet across the internet from your network to the server's network.
- Layer 2: Ethernet: You'll see the source and destination MAC addresses. These are hardware addresses used to deliver the packet on the local network segment (e.g., from your computer to your router).
Conclusion
In this lesson, you bridged theory and practice by capturing a real web request and dissecting it layer by layer. This is a foundational skill for any technical role involving networks.
Key Takeaways:
- A web request is a multi-step process initiated by a DNS query to resolve a name to an IP address.
- TCP establishes a reliable connection through a three-way handshake (
SYN,SYN-ACK,ACK) before any application data is sent. - The data is encapsulated in layers:
- Ethernet (Layer 2) uses MAC addresses for local delivery.
- IP (Layer 3) uses IP addresses for global routing.
- TCP (Layer 4) uses ports to direct data to the correct application.
tcpdumpis the essential tool for capturing traffic on the command line, whileWiresharkis the standard for in-depth graphical analysis.
In our next lesson, we will build directly on what we learned about IP addresses. Now that you've seen how they are used to route traffic, you'll learn how to design an IP addressing scheme for a small network using a given CIDR block and assign valid addresses to hosts. This moves us from analyzing traffic to planning the networks that carry it.