Hello! In our last lesson, we took active control of a server remotely, learning how to manage its power, use the KVM, and mount virtual media. This gave you the power to act on a server as if you were in the same room.
Today, we'll build on that by shifting from control to diagnosis. You'll learn how to become a hardware detective, using logs to find problems before they cause a critical outage. This lesson addresses the learning outcome: Interpret server hardware logs to identify trends indicating impending component failure (e.g., predictive disk failure).
Proactively identifying a failing component is a crucial skill for any data center professional. It’s the difference between a planned, low-impact maintenance window and a frantic, high-stress emergency repair. This ability to foresee and prevent disaster is highly valued and a great topic to discuss in job interviews.
1. The Two Worlds of Hardware Logs
When a server has a hardware problem, it can report it in two primary ways. Understanding both is key to getting a complete picture.
-
Out-of-Band (OOB) Logs: These are stored on the Baseboard Management Controller (BMC) itself. The log, typically called the System Event Log (SEL), is independent of the operating system. Even if the OS has crashed or the server won't boot, the BMC can still record events like power supply failures, fan issues, or critical temperature alerts. You access this log through the iDRAC/iLO web interface or with
ipmitool, as we saw previously. -
In-Band (OS-Level) Logs: These are generated by the running operating system (Linux, in our case). The OS has its own drivers and tools for monitoring hardware, providing a more detailed, "inside" view of components like storage drives and memory. These logs are found in familiar places like the kernel message buffer (
dmesg) and system log files (e.g.,/var/log/messagesor viajournalctl).
A good technician uses both. The BMC provides the high-level alert, and the OS logs often provide the deep, specific details needed for a precise diagnosis.
2. Predicting Storage Failure with S.M.A.R.T.
The most common components to fail in a server are those with moving parts, especially spinning hard disk drives (HDDs). To help predict these failures, drives are equipped with S.M.A.R.T. (Self-Monitoring, Analysis, and Reporting Technology).
S.M.A.R.T. constantly monitors dozens of internal drive attributes. By reading these attributes, we can see if a drive is healthy or if it's developing problems that indicate it's about to fail.
The standard tool for this on Linux is smartctl, part of the smartmontools package.
A Real-World Case Study
There's no better way to learn smartctl than by seeing it used to diagnose a real failing drive. The following video is a fantastic case study.
My Hard Drive Is Failing! - The smartctl Command & ddrescue Recovery Attempt
Watch this video from RobertElderSoftware where the presenter suspects his hard drive is failing. He uses Linux system logs and the smartctl command to investigate, interpret the data, and confirm the failure. This is a perfect practical application of the concepts we're discussing.
Please watch the following segments: Initial Discovery (00:00 - 01:52): See how an error in the system log (/var/log/syslog) prompts the investigation and how to get the initial smartctl -a report. Interpreting Attributes (01:52 - 05:28): This is the most important part. Pay close attention to the explanation of the attribute table, especially the discussion of 'pre-fail' attributes and the meaning of Current_Pending_Sector_Ct. Running Self-Tests (05:28 - 07:17): Learn how to actively command the drive to test itself using smartctl -t short and smartctl -t long. Notice that even if the overall health status says 'PASSED', a failed self-test is a definitive sign of a problem.
Key S.M.A.R.T. Attributes to Watch
As you saw in the video, the S.M.A.R.T. attribute list can be cryptic. While there are many attributes, a few are critical red flags. When you see a non-zero RAW_VALUE for these, you should plan to replace the drive immediately.
5 Reallocated_Sector_Ct: The number of bad sectors the drive has found and remapped to a spare area. This is the #1 indicator of a failing drive. A healthy drive has a raw value of 0.197 Current_Pending_Sector_Ct: Sectors that were difficult to read and are suspected of being bad. The drive will test them again later. If they are truly bad, they will be reallocated, andReallocated_Sector_Ctwill increase. A rising count here is a major warning sign.198 Offline_Uncorrectable: The number of uncorrectable errors found during offline scans. This is another clear sign of physical media degradation.
Other useful attributes include:
9 Power_On_Hours: Tells you how long the drive has been in service.194 Temperature_Celsius: Monitors drive temperature. Consistently high temperatures can reduce the lifespan of a drive.

Verifying Drive Authenticity
In a data center, you often deal with drives from various sources. It's crucial to verify that a drive is what it claims to be.
SERIOUSLY. CHECK YOUR HARD DRIVES RIGHT NOW! USED HDDs Sold as NEW.
This video from NASCompares discusses the problem of used drives being sold as new. It offers a valuable tip for verifying a drive's authenticity.
Watch the segment from 14:58 to 16:20. The presenter shows how to use a drive's serial number (which you can get from the smartctl -a output) to check its status on the manufacturer's website. This can reveal if the drive is genuine and whether it was originally sold as part of a larger system, implying it's not new.
3. Detecting Memory Errors
Modern servers use Error-Correcting Code (ECC) memory. Your ECE background gives you a head start here; ECC can detect and correct single-bit errors in real-time. This ability is crucial for server stability.
When we interpret memory logs, we're looking for two types of events:
-
Correctable Errors (CEs): The hardware corrected a single-bit error. The system continues to run without interruption. A few CEs over a long period might be acceptable cosmic rays at play, but a trend of CEs from the same memory module (DIMM) indicates that the DIMM is degrading and likely to fail soon. This is a form of Predictive Failure Analysis (PFA).
-
Uncorrectable Errors (UEs): The hardware detected a multi-bit error that it could not fix. This is a serious event that often leads to a system crash via a Machine Check Exception (MCE). The goal is to identify the faulty DIMM so it can be replaced.
Reading Memory Error Logs
In Linux, memory errors are reported to the kernel, which then logs them. You can find these reports using a few tools.
Testing and Validating the Memory Reliability of ThinkSystem V4 Servers
The following technical paper from Lenovo provides an extremely detailed look at how memory errors are handled in Linux. We will not read it all, but we will use it to understand the key logging mechanisms and what the logs look like.
Please read the section 'RAS in Linux OS'. Focus on the descriptions of the primary error reporting mechanisms: MCELOG, EDAC, and Rasdaemon. This will give you the vocabulary to understand where memory error logs come from.
In summary:
- EDAC (Error Detection and Correction) is a kernel subsystem that reports memory errors, often identifying the exact DIMM slot.
- mcelog is a daemon that collects and decodes MCEs from the CPU, which are triggered by more serious errors.
- rasdaemon is a more modern tool that aims to consolidate hardware error reporting from all sources, including EDAC and MCE events.
A Practical Example: Interpreting a Memory Error
Let's look at what these logs actually look like.
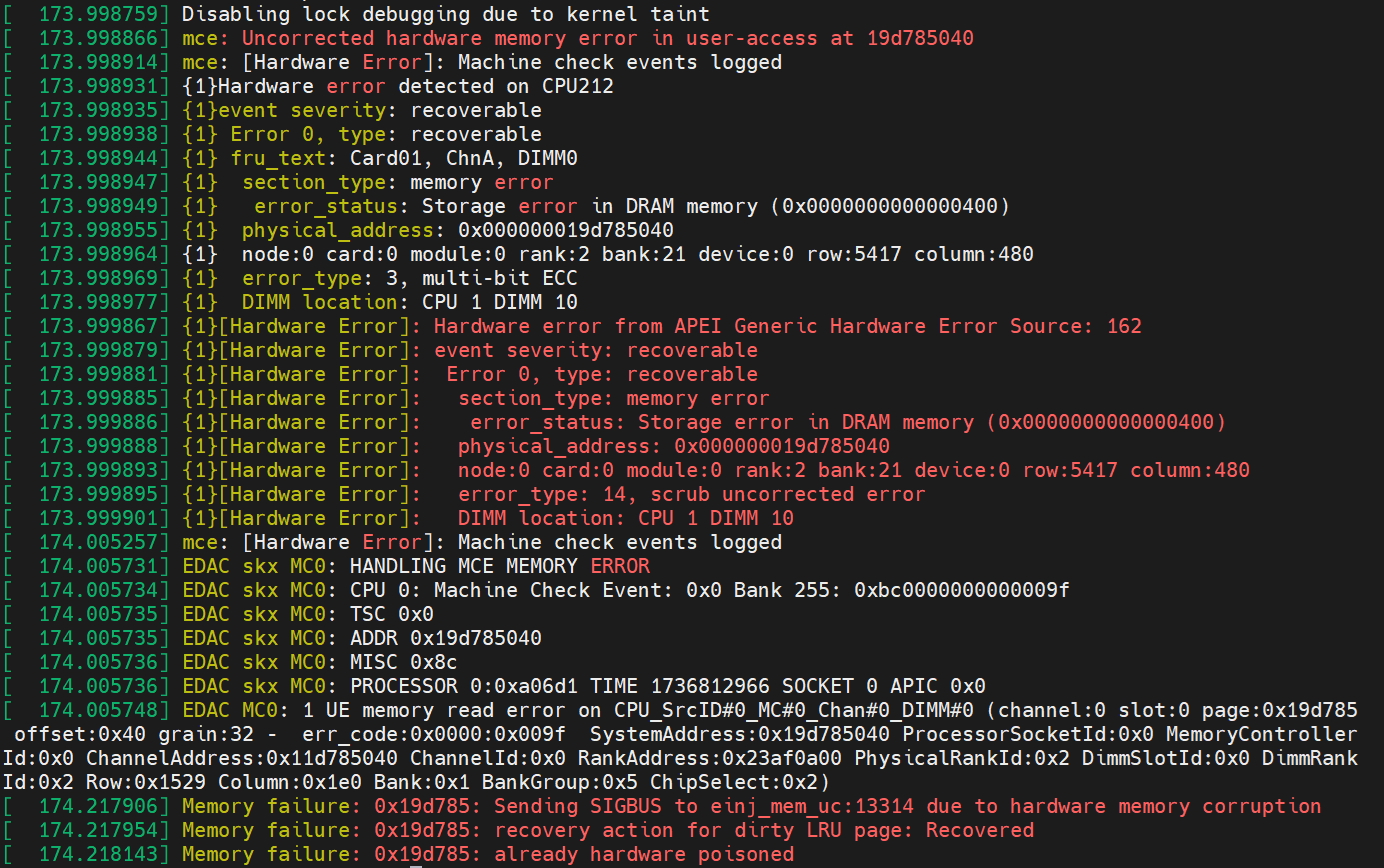
Let's break down one of the lines from an image like the one above:
[ 1145.123456] mce: [Hardware Error]: Machine check: 0 Bank 5: bea0000000000108[ 1145.123457] mce: [Hardware Error]: TSC 0 ADDR 1b9697000 MISC d012000101000000[ 1145.123458] mce: [Hardware Error]: PROCESSOR 0:c06f2 ...[ 1145.123459] EDAC MC1: 1 CE memory read error on CPU_SrcID#1_MC#1_Chan#0_DIMM#0 (channel:0 slot:0)
Interpretation:
mce: [Hardware Error]: An MCE occurred. This is serious.EDAC MC1: 1 CE memory read error: The EDAC driver reports a Correctable Error. Even though it was corrected, the fact that it triggered an MCE and is being logged means the system is tracking it.on CPU_SrcID#1_MC#1_Chan#0_DIMM#0: This is the money shot. The log is telling you the exact physical location of the fault: CPU socket 1, memory controller 1, channel 0, DIMM slot 0.
If you saw many of these messages all pointing to the same DIMM, you would have a clear trend indicating an impending failure. You would then schedule maintenance to replace that specific DIMM.
4. A Systematic Diagnostic Workflow
When you receive a report of an unhealthy server, you need a systematic approach.
-
Start with the BMC: Log in to the iDRAC/iLO/IPMI web interface.
- Check the main dashboard for status indicators (e.g., green, amber, red lights).
- Go to the System Event Log (SEL). Look for any critical errors or warnings related to power, fans, temperature, or predictive failures.
-
Move to the OS (if accessible):
- SSH into the server.
- Check the kernel ring buffer for recent critical events:
dmesg | grep -i -E "error|fail|fatal|warn|mce|critical" - Check all disks: Run
sudo smartctl -H /dev/sdXfor every disk. If any disk does not reportPASSED, runsudo smartctl -a /dev/sdXto get the full attribute list and look for the critical red flags. - Check for memory errors:
- Check the log files:
grep -i mce /var/log/messagesorjournalctl -p err | grep -i mce - If installed, use
rasdaemon:sudo ras-mc-ctl --summaryandsudo ras-mc-ctl --errors
- Check the log files:
-
Correlate and Conclude: Compare the findings from the BMC and the OS. Does the SEL event for "Predictive failure on Drive 3" match the
smartctlreport for/dev/sdc? Does the physical "fault" LED on DIMM B2 match thedmesglog pointing to that slot? This correlation confirms your diagnosis.
Conclusion
You now know how to look "under the hood" to find signs of hardware trouble before it brings a server down. By reading and understanding these logs, you can move from a reactive to a proactive mindset, a critical step in becoming a reliable systems administrator.
Key Takeaways:
- Hardware health is reported both Out-of-Band (OOB) in the BMC's System Event Log and In-Band by the operating system.
- For storage,
smartctlis the essential tool for reading S.M.A.R.T. data. Watch for key attributes likeReallocated_Sector_Ctto predict drive failure. - For memory, ECC corrects single-bit errors (CEs) and reports uncorrectable multi-bit errors (UEs).
- OS tools like
dmesg,mcelog, andrasdaemonhelp you interpret memory error logs to pinpoint the failing DIMM. - A pattern of correctable errors from a single component is a strong indicator of an impending failure.
In our next lesson, we will take action on today's diagnosis. You'll learn how to diagnose a failed storage device in a server, safely replace it in a RAID array, and verify the rebuild process. We'll move from finding the problem to fixing it in a live environment.