Hello! Welcome back.
In the last lesson, we explored how to manage CPU resource allocation using nice and renice. You learned to control which processes get more or less CPU time, a key skill for performance tuning. But what happens when a process you've carefully managed still fails? Or when a critical service stops for no apparent reason?
This is where logging comes in. System logs are the "black box recorder" for your Linux server. They are your primary tool for investigating what happened, why it happened, and when. In a data center environment, being able to quickly locate and understand logs is not just a skill—it's a necessity for maintaining uptime and resolving incidents.
Today's lesson is designed to equip you with this crucial skill. We will locate and interpret system logs in /var/log and journalctl to diagnose application or service errors. We'll explore the two main logging systems in Linux and learn the practical commands to read and filter logs effectively.
1. The Two Worlds of Linux Logging
To effectively find logs, you first need to understand that modern Linux systems typically use a hybrid approach to logging, combining a traditional method with a modern one.
- Traditional Syslog: This is the classic logging system. Services send their log messages to a daemon (like
rsyslog), which then writes them as plain text files into the/var/log/directory. Different types of messages are often sorted into different files. - Systemd Journal: This is the modern, integrated logging system. The
systemd-journalddaemon collects logs from the kernel, system services, and applications into a centralized, binary-formatted journal. It offers powerful filtering and is accessed via thejournalctlcommand.
Many systems run both, with journald capturing everything and forwarding it to rsyslog to be written to the traditional text files in /var/log. This gives you the best of both worlds: structured, queryable logs with journalctl and human-readable text files for simple tools like grep and tail.
This article provides a good overview of the most important log files and their purposes.
Linux Event Logs: Your Troubleshooting Guide
Let's start by getting a map of the territory. This article, "Linux Event Logs: Your Troubleshooting Guide", clearly lists the most common log files and explains the two logging architectures.
Please read the sections "Where to Find Linux Event Logs" and "The Linux Logging Architecture". Pay close attention to the table of log files; this is your treasure map for troubleshooting.
2. The Traditional Approach: Exploring /var/log
The /var/log directory is the classic home for log files. As you saw in the reading, it contains logs for system events, authentication, package management, and specific applications. To investigate these, we use standard text-manipulation tools.
Let's watch a video that walks through the most important files in /var/log and demonstrates how to view them.
Linux Crash Course - Understanding Logging
This video, "Linux Crash Course - Understanding Logging" from Learn Linux TV, provides a practical tour of the /var/log directory and introduces essential commands.
Watch the following segments, focusing on the file being discussed and the command used to view it: Introduction to /var/log: (00:00 - 03:39) auth.log and tail -f for real-time monitoring: (13:32 - 17:08) syslog for general system events: (17:32 - 19:08) dmesg for kernel messages: (21:44 - 24:26) - We will cover dmesg in more detail in the next lesson, but this is a good first look.
Practice Lab: Real-Time Troubleshooting
Let's replicate the most powerful technique shown in the video: monitoring a log file in real-time. This is a go-to method for diagnosing login issues.
-
Open two terminals.
-
In Terminal 1, start following the authentication log. On Debian/Ubuntu systems, this is
/var/log/auth.log. On RHEL/Fedora/CentOS, it's/var/log/secure.# On Debian/Ubuntu tail -f /var/log/auth.log # On RHEL/Fedora/CentOS (you might need sudo) sudo tail -f /var/log/secureYour terminal will now display the last few lines of the file and wait for new entries.
-
In Terminal 2, attempt to SSH into your own machine as a non-existent user.
ssh somefakeuser@localhost -
Switch back to Terminal 1. You should instantly see new lines appear, logging the failed authentication attempt. This immediate feedback is invaluable during troubleshooting.
Press Ctrl+C in Terminal 1 to stop tail.
3. The Modern Approach: The journalctl Swiss Army Knife
While tail and grep are great for simple text files, journalctl is the superior tool for navigating the modern systemd journal. Because the journal is structured, journalctl allows for powerful filtering that isn't possible with plain text files.
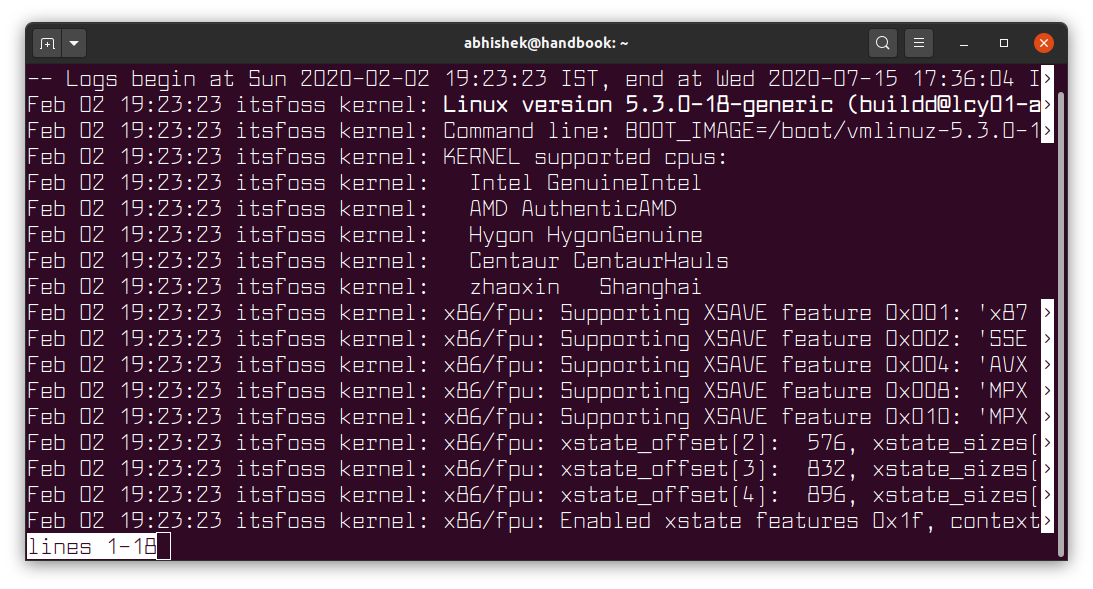
Let's explore journalctl with a video dedicated to its core functions.
journalctl Basics: How to Easily Check Your Linux Logs
The video "journalctl Basics: How to Easily Check Your Linux Logs" will walk you through the most important features of this command.
Please watch from the beginning to 15:23. As you watch, try the commands on your own system. Focus on understanding: What the systemd journal is (00:34 - 04:21). How to view logs and use follow mode (-f) (04:10 - 05:35). How to filter by service/unit (-u), which is essential for diagnosing service failures (05:25 - 12:04). How to filter by time (--since), which is crucial for isolating incidents (11:53 - 15:23).
Practice Lab: Diagnosing a Service Failure
This is the bread-and-butter of a system administrator. A service is failing, and you need to know why.
-
Let's check the status of a common service,
sshd.systemctl status sshdNotice that the output includes the most recent log entries for this service. This is your first clue.
-
Now, let's say the service was failing and you needed more history. You can use
journalctlwith the-u(unit) flag to see all logs just for that service.journalctl -u sshd.serviceUse the arrow keys to scroll, and press
qto quit. -
This can still be a lot of information. Let's narrow it down to only show logs from the last hour and only show errors or worse. The
-pflag stands for priority.journalctl -u sshd.service --since "1 hour ago" -p errThis command is extremely powerful. In a real incident, it cuts through thousands of informational messages to show you exactly what went wrong and when.
4. Application-Specific Logs
It's important to remember that many complex applications manage their own logs inside /var/log. A web server like Apache or Nginx is a perfect example. While systemd might log that the service started or stopped, the details of web requests (access logs) and application-level errors (error logs) are in their own files.
Linux Logs Investigations - Medium
This article, "Linux Logs Investigations", has an excellent section on application logs, using Apache2 as an example. This is directly applicable to many data center roles.
Please read "Task 8: Analysing Application Logs". Focus on understanding the difference between access.log (who requested what) and error.log (what went wrong with the server itself).
When troubleshooting an application, your process should be:
- Check the service status with
systemctl status <service-name>. - Check the systemd journal for service-level errors with
journalctl -u <service-name> -p err. - Check the application's specific logs in
/var/log/<application-name>/for detailed error messages.
Conclusion
Great job! You've just learned one of the most fundamental skills in system administration. Knowing where to look for logs and how to filter them is the difference between a 10-minute fix and a multi-hour outage.
Key Takeaways:
- Two Logging Systems: Linux uses both the traditional
/var/logtext files and the modernsystemdjournal. - Key Log Locations:
/var/log/syslogor/var/log/messages: General system activity./var/log/auth.logor/var/log/secure: Login and authentication events./var/log/<app_name>/: Application-specific logs (e.g.,/var/log/apache2/).
- Essential Commands:
tail -f <file>: To watch a text log file in real-time.grep <pattern> <file>: To search for specific text within a log.journalctl: The all-in-one tool for querying the systemd journal.journalctl -u <service>: The go-to command for diagnosing a specific service.journalctl -p err: To filter out noise and see only errors.
In our next lesson, we will focus specifically on hardware-related issues. You'll learn how to use dmesg to inspect kernel ring buffer messages. This is the log you'll turn to when the system has a problem with a disk, a network card, or any other piece of physical hardware.