Hello! Welcome back to your course on data center operations.
In our last lesson, you learned how to perform preventive maintenance by conducting manual hardware health checks with tools like smartctl and updating firmware. You practiced pulling information from a server to check its health. Today, we're flipping that model. We'll set up systems to push information to you automatically when they detect a problem.
This lesson directly addresses the learning outcome: Implement a monitoring alert for a potential failure trend (e.g., rising disk errors). We'll move from the reactive world of manual checks to the proactive world of automated alerting, a fundamental skill for any data center professional. You'll learn how to make the system tell you it's getting sick, long before it fails.
From Manual Checks to Automated Alerts
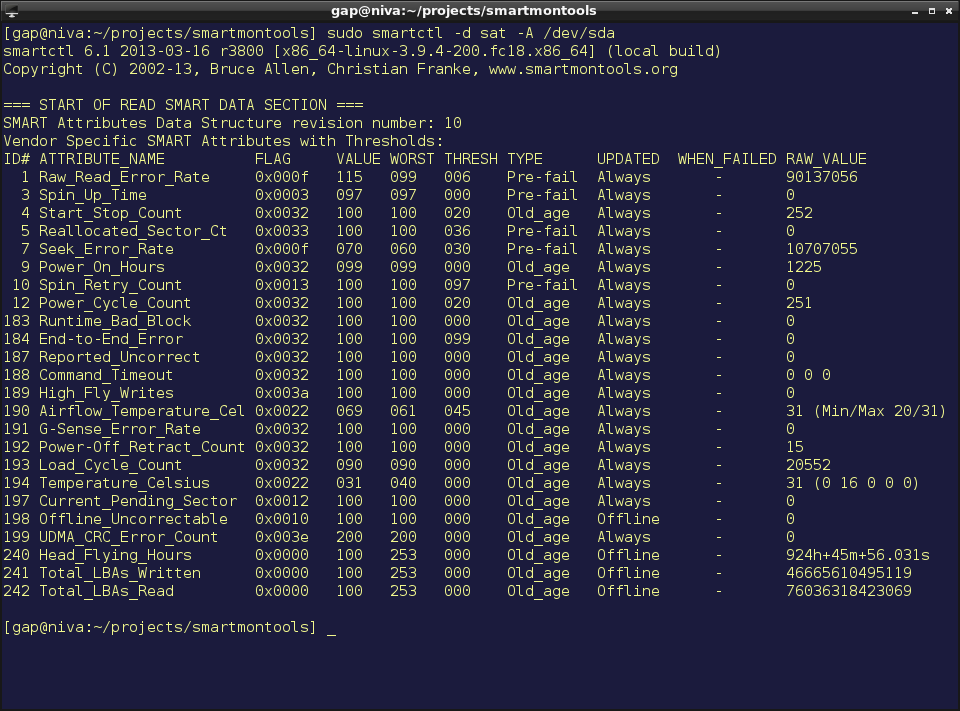
In the last lesson, you ran sudo smartctl -a /dev/sda and looked for indicators of disk failure, such as the Reallocated_Sector_Ct. This is great for a spot-check, but you can't run it on every server every hour. It's not scalable. What if that reallocated sector count starts to increase right after you've checked it?
The solution is to automate this process. We'll explore two approaches:
- A dedicated tool (
smartd): A simple, robust daemon that does one thing well: monitor disk health and send basic alerts. - A comprehensive monitoring system (Prometheus): A modern, powerful, and widely-used platform for collecting metrics and creating sophisticated alerts for your entire infrastructure.
Your "practice-first" approach will serve you well today as we dive into hands-on configuration.
Part 1: Direct Alerting with the smartd Daemon
The simplest way to automate the checks you learned is with smartd, the daemon that comes with the smartmontools package. It runs in the background, periodically checks the S.M.A.R.T. status of your drives, and can send an email if it finds a problem.
Let's use a guide to understand the setup process.
Utilizing SMART Tools for Effective Disk Health Monitoring in Linux Servers
The article 'Utilizing SMART Tools for Effective Disk Health Monitoring in Linux Servers' from WafaTech provides a concise guide to setting up automated monitoring with smartd. We'll use it to configure our first alert.
Focus on these practical sections: Installation of Smartmontools: Review this section to ensure the tool is installed. You likely did this in the last lesson. Automating Monitoring with smartd: This is the core of our task. Pay close attention to the configuration file (/etc/smartd.conf) and the commands to start the service. Interpreting SMART Attributes: Re-read this section. It explains what smartd is looking for. A rising Reallocated Sectors Count is a classic 'failure trend'.
Practical Steps to Implement a smartd Alert
Let's walk through the process of setting up an alert for a failing disk.
-
Install
smartmontools(if not already done):
On a Debian/Ubuntu system:sudo apt update sudo apt install smartmontools -
Configure
smartd:
Open the configuration file in a text editor likenano:sudo nano /etc/smartd.confThis file tells the
smartddaemon which devices to monitor and how. You'll likely see a lot of commented-out examples. The simplest way to start is to find the line that saysDEVICESCANand add your monitoring instruction below it.# The DEVICESCAN directive scans for devices and monitors them with default settings. DEVICESCAN # Or, to monitor a specific device with specific options: /dev/sda -a -m your-email@example.com -M exec /usr/share/smartmontools/smartd-runnerLet's break down this line:
/dev/sda: The device to monitor.-a: A recommended default set of monitoring options. It includes tracking all vendor-specific S.M.A.R.T. attributes.-m your-email@example.com: This is the alert destination.smartdwill attempt to email this address if it detects an issue.-M exec /usr/share/smartmontools/smartd-runner: This directive tellssmartdto use a script to format and send the email. It produces a clean, readable report.
-
Start and Enable the Service:
Now, tellsystemdto start the daemon and ensure it runs automatically on boot.sudo systemctl start smartd sudo systemctl enable smartdYou can check its status with
sudo systemctl status smartd.
That's it. The smartd daemon is now running, and if it detects that the health of /dev/sda is degrading (e.g., reallocated sectors are increasing, or the overall health assessment fails), it will send an alert to the email address you specified. You have successfully implemented your first automated monitoring alert.
Part 2: Industry-Standard Monitoring with Prometheus
While smartd is great for disk health on a single machine, modern data centers monitor thousands of metrics across hundreds or thousands of servers. For this, they use comprehensive systems like Prometheus.
Prometheus is an open-source monitoring and alerting toolkit that is incredibly popular in the industry. Understanding its architecture is a key skill for your career goal.
Understanding the Prometheus Architecture
Let's start with a high-level overview of why Prometheus exists and how it works. The following video explains this very clearly.
How Prometheus Monitoring works | Prometheus Architecture explained
The video 'How Prometheus Monitoring works' from TechWorld with Nana is one of the best explanations of the concepts behind modern monitoring. It will help you understand the 'why' behind the architecture.
Watch the first part of the video (01:26 to 07:37) to grasp the core ideas: The Problem: Pay attention to the examples of how complex failures happen and why manual debugging is difficult. The Solution: See how a monitoring tool can predict issues like running out of memory or disk space by tracking trends. Prometheus Architecture: Focus on the three main parts of the Prometheus server: the time-series database (TSDB), the data retrieval worker (scraper), and the web server API.
The key takeaway is that Prometheus pulls metrics from targets over HTTP. It doesn't wait for systems to push data to it. This makes the setup very robust. But how does a Linux server expose metrics like disk health in a way Prometheus can understand?
Exporters: The Bridge to Prometheus
Most applications and systems don't expose Prometheus-compatible metrics by default. To solve this, we use small helper programs called exporters. An exporter sits on the target machine, collects the metrics (e.g., from smartctl), and presents them on an HTTP endpoint (like http://<server-ip>:9100/metrics) for Prometheus to scrape.
For monitoring a Linux server, the most common exporter is the Node Exporter, which exposes hundreds of metrics, including CPU, memory, network, and disk I/O. For detailed S.M.A.R.T. data, you might use a dedicated smartmontools_exporter.
Let's continue with the video to see how this works.
How Prometheus Monitoring works | Prometheus Architecture explained
This next section of the video explains the crucial roles of exporters and the Prometheus configuration file.
Watch these two key segments: Exporters and Client Libraries (08:45 - 12:15): Understand how exporters like the node_exporter for Linux translate system metrics into the Prometheus format. Configuration and Alerting (14:25 - 17:04): This is the most important part for our learning outcome. Focus on the roles of prometheus.yml (tells Prometheus what to scrape), the rule files (define when to create an alert), and the Alertmanager (handles sending the alert).
Creating an Alert in Prometheus
You have just learned the three components of a Prometheus alert:
- Prometheus Server: Configured in
prometheus.ymlto scrape a target (like the Node Exporter). - Alerting Rule: A file that defines the failure condition. It's written in a special format.
- Alertmanager: A separate component that receives alerts from Prometheus and routes them to email, Slack, PagerDuty, etc.

Let's make this concrete. To implement an alert for rising disk errors, you would:
-
Run the
smartmontools_exporteron your target server. -
Add that exporter as a target in your
prometheus.ymlfile. -
Create an alerting rule like this in a rule file:
groups:
- name: disk_alerts
  rules:
  - alert: PredictiveDiskFailure
    expr: smartmon_device_smart_health_passed == 0
    for: 5m
    labels:
      severity: critical
    annotations:
      summary: "Disk S.M.A.R.T. health check failing on {{ $labels.instance }}"
      description: "Device {{ $labels.device }} is reporting a S.M.A.R.T. health failure. Overall status is NOT PASSED."

  - alert: ReallocatedSectorsIncreasing
    expr: smartmon_device_attribute_current{name="reallocated_sector_count"} > 5
    for: 1h
    labels:
      severity: warning
    annotations:
      summary: "High number of reallocated sectors on {{ $labels.instance }}"
      description: "Device {{ $labels.device }} has {{ $value }} reallocated sectors, indicating physical surface degradation."
Dissecting the Rule:
alert: The name of the alert.expr: The expression to evaluate. This is the heart of the rule. The first rule triggers if the main health check fails. The second triggers if the reallocated sector count is greater than 5.for: 1h: This is crucial for monitoring a trend. It means the condition must be true for one continuous hour before the alert fires. This prevents "flapping" alerts for temporary spikes.labelsandannotations: These add metadata, like severity, and provide a human-readable summary for the notification.
While setting up a full Prometheus stack is a lesson in itself, you now understand the components and the logic required to implement a sophisticated, trend-based alert that is far more powerful than a simple email from smartd.
Conclusion
Today, you have bridged the gap between manual checks and automated infrastructure monitoring. You've seen how to turn the data from a health check into a proactive alert that can warn you about a failure trend before it causes an outage.
Key Takeaways:
- Automated monitoring is essential for managing infrastructure at scale and preventing downtime.
smartdis a simple, effective daemon for creating dedicated alerts about disk health on a single machine.- Prometheus is a modern, industry-standard monitoring system based on a pull model, where it scrapes metrics from exporters.
- Implementing a Prometheus alert involves three key parts: the Prometheus server to scrape data, an alerting rule to define the failure condition, and the Alertmanager to send the notification.
- Using clauses like
for: 1hin an alert rule allows you to monitor a trend (a sustained problem) rather than reacting to temporary glitches.
In our next lesson, we will address what happens after an alert fires and an incident occurs. You'll learn how to write a structured Root Cause Analysis (RCA) report for a simulated production incident, a critical skill for demonstrating accountability and learning from failures.