Hello! Welcome to our next lesson.
In our previous session, we established a conceptual framework for log-linear models. We saw how different models can represent specific hypotheses about the association structure in a contingency table, primarily by including or excluding interaction terms. We focused on two key models for a two-way table:
- The independence model, which assumes no association between the variables.
- The saturated model, which includes an interaction term and perfectly describes the observed data.
Today, we will connect these abstract models to a very familiar statistical tool: the chi-square test of independence. By the end of this lesson, you will be able to explain the relationship between the chi-square test and the saturated log-linear model. This will reframe the chi-square test not as an isolated procedure, but as a specific instance of model comparison within the powerful Generalized Linear Model (GLM) framework.
1. Reframing the Chi-Square Test
Let's start by revisiting the Pearson chi-square test for independence in a two-way table. You'll recall that its purpose is to test the null hypothesis () that the two categorical variables are independent.
The test statistic is calculated as:
The core of this test lies in the comparison between the observed counts in each cell and the expected counts we would see if the null hypothesis of independence were true.
Now, let's look at this through the lens of log-linear models.
-
What are the "Expected" counts? The expected counts for the chi-square test are calculated under the assumption of independence. These are precisely the counts predicted by the log-linear model of independence.
The fitted values, , from this model are identical to the expected counts, , used in the standard chi-square test formula.
-
What are the "Observed" counts? The observed counts, , are the actual data. The log-linear model that perfectly reproduces the observed counts is the saturated model.
Because this model has a parameter for every cell, its fitted values are the observed counts themselves: .
Therefore, the chi-square test is fundamentally a goodness-of-fit test. It measures how well the simpler independence model fits the data, using the saturated model (i.e., the observed data) as the benchmark for a perfect fit.
The following reading makes this connection explicit.
10 Log-Linear Models – STAT 504 | Analysis of Discrete Data
This text from Penn State's STAT 504 course directly states the relationship between the chi-square test and the log-linear model of independence.
Please read the subsections '10.1.1 Model of Independence' and '10.1.2 Saturated Model'. Focus on the paragraph in the first section that begins 'The maximum likelihood (ML) fitted values...'. Then, in the second section, note how the saturated model is described as a 'perfect fit'.
2. A Formal Model Comparison: The Likelihood Ratio Test
The Pearson chi-square statistic () is one way to measure the distance between the observed and expected counts. Another, which is more directly tied to the logic of model comparison, is the Likelihood Ratio Test statistic, often denoted as .
For contingency tables, the statistic is calculated as:
Just like the Pearson , follows a chi-square distribution under the null hypothesis and is used to test for independence. In practice, and usually give very similar results.
The power of the statistic is that it provides a general way to compare nested models. A simpler model (e.g., independence) is "nested" within a more complex model (e.g., saturated) if it can be obtained by setting some parameters of the complex model to zero.
The chi-square test of independence can be formally stated as a likelihood ratio test comparing two models:
- Null Model (): The log-linear model of independence.
- Alternative Model (): The saturated log-linear model.
The test statistic is the difference in their deviances (a measure of model fit, where lower is better). The deviance of the saturated model is always 0 because it fits perfectly. Therefore, the for the test of independence is simply the deviance of the independence model.
In essence, the chi-square test of independence asks: "Is the fit of the independence model significantly worse than a perfect fit?"
3. Seeing the Connection in Practice
This idea that common statistical tests are just specific versions of linear (or generalized linear) models is a powerful concept in modern statistics. It unifies many different procedures under a single framework.
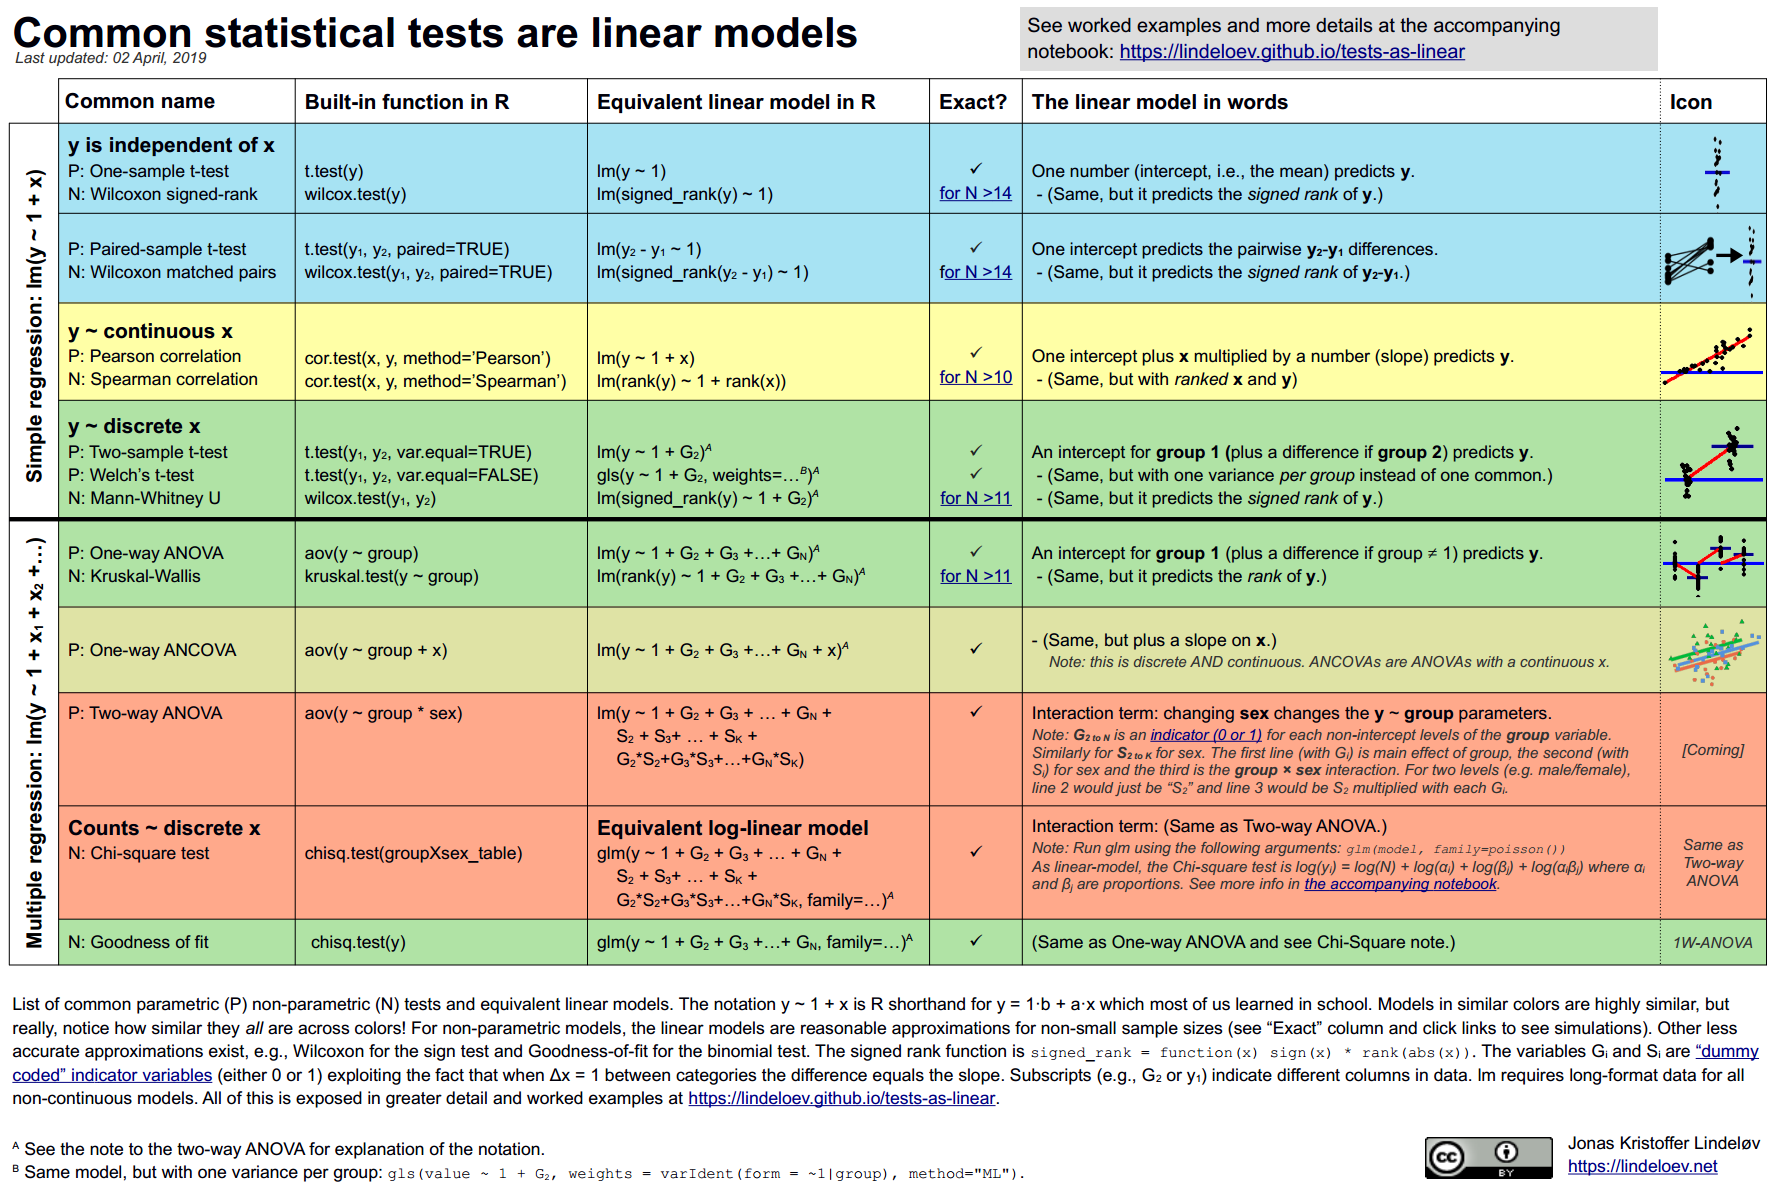
Let's look at how this plays out with code. We can perform a chi-square test of independence in two ways: using the standard chisq.test() function or by fitting and comparing two log-linear models. The results will be the same.
Common statistical tests are linear models (or: how to teach stats)
This article demonstrates the equivalence with a practical example in R. It will show you that testing for the significance of the interaction term in a log-linear model is the same as performing a chi-square test of independence.
Please read subsections '7.2.1 Theory: As log-linear model' and '7.2.3 R code: Chi-square test'. In the theory section, notice how the author transforms a multiplicative model of proportions into an additive log-linear model. In the code section, focus on the part where chisq.test(D_table) is compared to anova(null, full, test = 'Rao'). The null model is the independence model, and the full model is the saturated model.
As you saw in the reading, the analysis produces a p-value for the mood:sex interaction term in the log-linear model. This p-value is identical to the one produced by the standard chisq.test.
This confirms our key insight: testing for independence is equivalent to testing whether the interaction term () in the saturated log-linear model is zero.
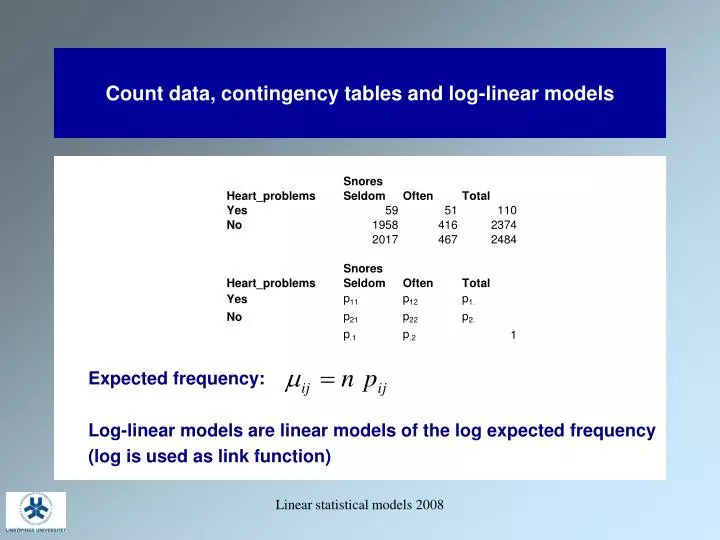
Conclusion
Today we connected the dots between two important concepts: the familiar chi-square test and the more general framework of log-linear models. This new perspective is more than a theoretical curiosity; it's a gateway to more advanced analyses. While the chi-square test tells you if there's an association, analyzing different log-linear models allows you to describe how variables are associated, especially in complex, multi-way tables.
Key Takeaways:
- The chi-square test for independence compares observed cell counts to the expected cell counts calculated under the assumption of independence.
- The saturated log-linear model perfectly reproduces the observed cell counts.
- The log-linear model of independence perfectly reproduces the expected cell counts used in the chi-square test.
- Therefore, the chi-square test of independence is implicitly a goodness-of-fit test that compares the fit of the independence model against the saturated model.
- Testing for independence is equivalent to testing the null hypothesis that the interaction term in the saturated log-linear model is zero.
Preview of the Next Lesson:
We've now established what log-linear models are and how they relate to classical tests. In the next lesson, we will solidify the connection between Poisson regression and log-linear models. You'll learn that fitting a log-linear model is practically accomplished by running a Poisson regression, which provides the computational engine for everything we've discussed.