Hello! Welcome to our next lesson.
In our last session, we focused on making logistic regression results interpretable by converting the model's coefficients into odds ratios. Now that we can fit a model and understand what its coefficients mean, we must address a fundamental question: Is the model any good?
This lesson tackles that question by introducing you to methods for assessing a model's goodness of fit. This is different from assessing predictive accuracy. Goodness-of-fit statistics help us determine if the model's structure is appropriate for the data, or if we could build a better model by adding more complexity (like non-linear terms or interactions).
By the end of this lesson, you will be able to assess a logistic regression model's fit using two key approaches: deviance-based statistics and the Hosmer-Lemeshow test.
What is Goodness of Fit?
It's crucial to distinguish between two ways of evaluating a model:
- Measures of Predictive Power: These tell you how well the model predicts the outcome. We'll cover metrics like the Area Under the ROC Curve (AUC) in a future lesson. A model can have low predictive power but still be a "good fit."
- Goodness-of-Fit (GOF) Tests: These are formal hypothesis tests where the null hypothesis () is that the model is correctly specified and fits the data well. A non-significant result (high p-value) is what we want, as it indicates no evidence of a poor fit.
A model with low predictive power might simply reflect a reality where the outcome is hard to predict. However, a model that fails a GOF test suggests that the underlying mathematical assumptions are wrong—for example, a linear relationship was assumed when a curved one was needed. The paper below by Paul Allison gives an excellent introduction to this distinction.
Measures of Fit for Logistic Regression
To start, please read the introduction of the paper 'Measures of Fit for Logistic Regression'. It clearly lays out the difference between measures of predictive power and goodness-of-fit tests.
Read the 'INTRODUCTION' section, which spans the first page. Pay close attention to the paragraph that begins 'What many researchers fail to realize is that measures of predictive power and goodness-of-fit statistics are testing very different things.'
Assessing Fit with Deviance
In linear regression, you are familiar with the Residual Sum of Squares (RSS) as a measure of how far the data points are from the fitted regression line. A smaller RSS indicates a better fit.
In logistic regression, the equivalent concept is deviance. Deviance is derived from the model's log-likelihood and serves the same purpose: a lower deviance indicates a better fit to the data.
Deviance in logistic regression models
First, let's understand why we need a concept like deviance instead of just using RSS. This video from Equitable Equations explains the issue with RSS in a logistic regression context and introduces deviance as the more theoretically sound alternative.
Please watch from 01:07 to 05:54. The video explains why the variance of residuals in logistic regression is not constant, making RSS a poor metric, and then introduces the concept of deviance based on the likelihood function.
The Null, Proposed, and Saturated Models
To use deviance effectively, we compare our model against two benchmarks:
- Null Model: The simplest model, containing only an intercept. It predicts the same probability (the overall sample proportion) for every observation. This represents the worst-case scenario, our baseline. Its deviance is called the Null Deviance.
- Proposed Model: This is the model you have actually fitted, with your chosen predictors. Its deviance is often called the Residual Deviance.
- Saturated Model: A hypothetical, perfect model with one parameter for every data point. It fits the data perfectly. This represents the best-case scenario. For logistic regression with ungrouped binary data, its log-likelihood is 0, which means its deviance is also 0.
The StatQuest video below provides a brilliant conceptual overview of these three models and how deviance is used to compare them.
This video, 'Saturated Models and Deviance', is one of the best explanations available for these core concepts. It will help you build a strong mental model for what deviance statistics represent.
Please watch the following segments: 01:44 to 05:26: Introduces the null, proposed, and saturated models. 08:53 to 13:18: Defines residual deviance and null deviance. 15:49 to 17:18: Explains the key simplification for logistic regression, where the saturated model's log-likelihood is 0.
Using Deviance in Practice
There are two primary ways we use deviance statistics:
1. Comparing Nested Models (Likelihood Ratio Test)
The difference in deviance between two nested models (where one is a simpler version of the other) follows a chi-square distribution. This is known as the Likelihood Ratio Test.
The test statistic is .
The degrees of freedom are the difference in the number of parameters between the two models.
For example, to test the overall significance of your model, you can compare your proposed model (full) against the null model (reduced):
A significant p-value here means your model as a whole is a significant improvement over just using the intercept.

2. The Deviance Goodness-of-Fit Test
This test compares your proposed model against the saturated model to assess overall fit. The test statistic is simply the Residual Deviance of your model.
The degrees of freedom are , where is the number of unique combinations of predictor variables (covariate patterns) and is the number of parameters in your model.
When it fails: This test is only reliable when you have replicated data—that is, multiple observations for each unique covariate pattern. In most modern datasets, especially those with continuous predictors, each observation is its own unique pattern ( is close to the sample size ). In such cases, the chi-square approximation is poor, and this test is not valid.
The Hosmer-Lemeshow Test
So, what do we do when the deviance GOF test isn't valid? The Hosmer-Lemeshow (H-L) test was designed specifically for this common scenario.
How It Works (Conceptually)
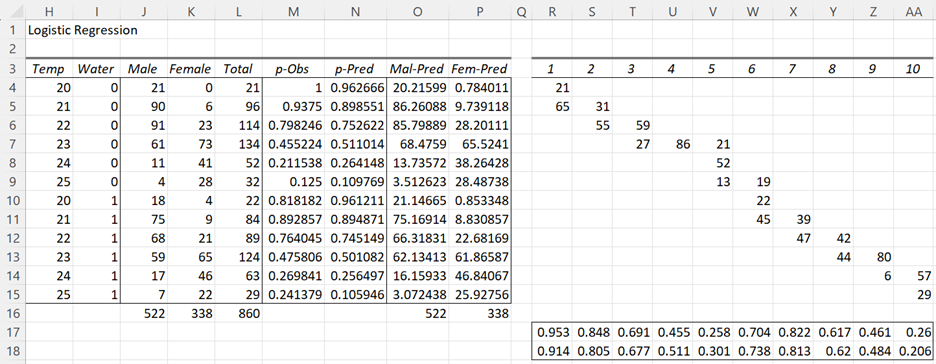
The H-L test uses a clever grouping strategy:
- Fit your model and get the predicted probability for every observation.
- Sort the data based on these predicted probabilities, from lowest to highest.
- Divide the data into groups of roughly equal size (10 is the standard). This creates "deciles of risk."
- For each group, compare the observed number of events to the expected number of events (which is the sum of predicted probabilities for that group).
- A chi-square statistic is calculated from these observed and expected counts. The degrees of freedom are .
Interpretation
The null hypothesis for the H-L test is that the model fits the data well. Therefore, a high p-value () is good, indicating no statistical evidence of a poor fit. A low p-value suggests the model is misspecified.
12.1 - Logistic Regression | STAT 462
The following resource provides a clear summary of the Pearson, Deviance, and Hosmer-Lemeshow tests, and clearly states when each is appropriate.
Please read the section titled 'Goodness-of-Fit Tests.' Note how it explicitly states that the deviance and Pearson tests require replicated data, while the Hosmer-Lemeshow test is useful for unreplicated datasets. Observe the interpretation of the example output.
When It Fails: The Problems with the Hosmer-Lemeshow Test
While widely used, the H-L test has several well-documented and serious limitations that you must be aware of for a proper functional understanding.
Measures of Fit for Logistic Regression
Now for the critical part. The same paper by Paul Allison that you read earlier contains an excellent critique of the Hosmer-Lemeshow test. Understanding these weaknesses is key to using it responsibly.
Please read the section starting with 'Hosmer and Lemeshow (1980) proposed grouping cases...' up to '...I will recommend four of them that I think are worthy of consideration.' This section details the major problems with the H-L test, such as its sensitivity to the number of groups and its sometimes counter-intuitive behavior.
As you just read, the main problems are:
- Arbitrary Grouping: The test result can change dramatically depending on the number of groups you choose (e.g., 9 vs. 10).
- Counter-intuitive Behavior: Adding a significant variable can sometimes make the fit worse according to the H-L test, and vice-versa.
- Low Power: It may fail to detect certain types of important model misspecification.
Because of these issues, a non-significant H-L test is reassuring but not definitive proof of a good fit. A significant H-L test, however, should be treated as a serious red flag that your model may be misspecified.
Conclusion
You now have the tools to evaluate whether your logistic regression model provides a good fit to your data.
Key Takeaways:
- Goodness of fit assesses if the model's structure is correct, which is distinct from its predictive power.
- Deviance is the key metric for fit in logistic regression, analogous to RSS in linear regression. Lower deviance is better.
- The Deviance Goodness-of-Fit Test (using the residual deviance) is a formal test of fit but is only valid for grouped/replicated data.
- The Hosmer-Lemeshow (H-L) Test is used for the common case of ungrouped data (e.g., with continuous predictors). A high p-value indicates a good fit.
- The H-L test has serious limitations, including sensitivity to the number of groups and low power. It should be interpreted with caution.
Preview of the Next Lesson:
We have focused on assessing the fit of the model's structure. In the next lesson, we will shift gears to assess its performance. We will ask: How well does our model actually distinguish between the two outcomes? To answer this, we will introduce the confusion matrix and derive essential performance metrics like sensitivity and specificity.