Introduction
Welcome to the second module of our course! In the previous module, we focused on describing and measuring the relationship between two categorical variables using tools like contingency tables, the difference in proportions, relative risk, and the odds ratio.
Now, we shift from description to inference. Just because we observe an association in our sample data, how do we know if it reflects a real relationship in the underlying population, or if it could have simply occurred by random chance? This module is dedicated to answering that question through formal hypothesis testing.
This lesson covers the very first and most crucial step in this process: learning how to state the null and alternative hypotheses for a test of independence. A clear understanding of this step provides the logical foundation for the statistical tests that follow.
1. The Core Idea: What is Statistical Independence?
Before we can test for a relationship, we need to formally define what it means for there to be no relationship. In statistics, this concept is called independence.
Two categorical variables are independent if the value of one variable tells you nothing about the value of the other. For example, we would probably expect a person's eye color to be independent of their preferred brand of toothpaste. Knowing their eye color doesn't help you guess their toothpaste choice.
Conversely, two variables are associated or dependent if knowing the value of one variable gives you information about the value of the other. For instance, a person's smoking status and their risk of developing lung cancer are clearly associated.
In hypothesis testing, we start by assuming the "boring" scenario—that there is no relationship—and then we look for evidence to prove otherwise.
2. Stating the Hypotheses: The Conceptual Level
The foundation of any hypothesis test is a pair of competing statements: the null hypothesis and the alternative hypothesis.
- The Null Hypothesis () is the statement of no effect or no relationship. It represents the status quo that we assume to be true unless we find strong evidence against it.
- The Alternative Hypothesis ( or ) is the statement we are trying to find evidence for. It's the claim that there is an effect or a relationship.
For a test of independence in a contingency table, the hypotheses are straightforward.
Chi-Square Test of Independence | Formula, Guide & Examples
The article 'Chi-Square Test of Independence' from Scribbr provides a very clear and practical way to formulate these hypotheses. Let's start here.
Please read the section titled 'Chi-square test of independence hypotheses'. It provides simple templates for writing out H₀ and Hₐ.
As the article explains, we can state the hypotheses as follows:
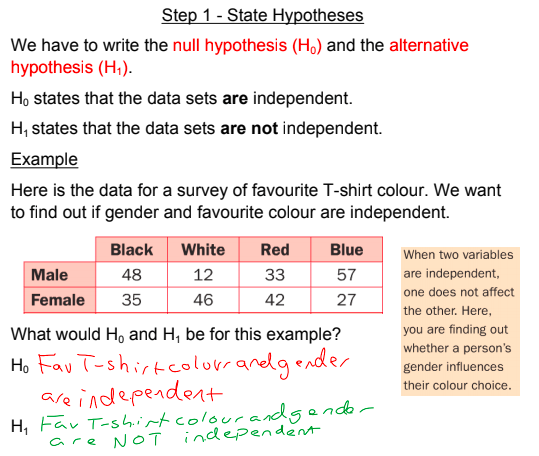
- : [Variable 1] and [Variable 2] are independent (not related).
- : [Variable 1] and [Variable 2] are dependent (related).
Let's look at a concrete example to make this clear.
3. Stating the Hypotheses: The Proportions Level
Another, more specific, way to think about independence is in terms of proportions. If two variables are independent, the distribution of one variable should be the same across all levels of the other variable.
For a 2x2 table, this simplifies to saying that the proportion of the outcome is the same in both exposure groups. This connects directly to the "difference in proportions" you learned about in the first module.
Chi Square Test of Independence | Statistics Tutorial #29| MarinStatsLectures
The video 'Chi Square Test of Independence' by MarinStatsLectures does an excellent job of explaining how to frame the hypotheses in terms of population proportions.
Please watch from 01:16 to 04:25. The first part (until 01:50) states the hypotheses in terms of association, just as we did above. The second part (starting at 03:21) shows how to state them by comparing two population proportions, p₁ and p₂.
Based on the video, for a 2x2 table comparing two groups, the hypotheses can also be stated as:
- :
- This means the proportion of the outcome in population 1 is equal to the proportion of the outcome in population 2.
- :
- This means the proportions are not equal.
For a larger table, the logic is the same: the null hypothesis states that the vector of proportions for the outcome variable is the same across all rows.
4. Stating the Hypotheses: The Formal Definition
Finally, let's look at the most formal mathematical definition of independence. This is the definition that the chi-square test is built upon, so understanding it is key to understanding how the test works in the upcoming lessons.
Statistical independence means that the joint probability of two events occurring is equal to the product of their individual (marginal) probabilities.
Let's use to denote the probability of an observation falling into the cell in row and column .
Let be the marginal probability of being in row , and be the marginal probability of being in column .
3 Two-Way Tables: Independence and Association – STAT 504
The STAT 504 course notes from Penn State provide a formal definition of statistical independence and how it translates into the null and alternative hypotheses.
Please read the subsection titled '3.3 Test for Independence'. Focus on the 'Definition 3.6 (Statistical Independence)' and the formulation of H₀ and Hₐ that follows.
As detailed in the reading, the formal hypotheses are:
- : for all cells .
- This states that for every cell in the table, the joint probability is the product of the corresponding marginal probabilities. This is the formal definition of independence.
- : for at least one cell .
- This states that the independence model does not hold. The variables are associated.
This formal definition is what allows us to calculate the expected counts under the assumption of independence, which is the next step in performing a chi-square test.
Conclusion
In this lesson, you have learned the critical first step for testing the relationship between two categorical variables. We established the framework of a null hypothesis representing independence and an alternative hypothesis representing association.
Key Takeaways:
- The null hypothesis () for a test of independence is that the two categorical variables are not related (i.e., they are independent).
- The alternative hypothesis () is that the two variables are related (i.e., they are dependent or associated).
- These hypotheses can be expressed in three ways:
- Conceptually: In words, stating whether the variables are independent or dependent.
- In terms of proportions: Stating that the proportions of the outcome variable are equal across all categories of the explanatory variable ().
- Formally: Using probabilities, stating that the joint probabilities are the product of the marginal probabilities ().
Preview of the Next Lesson:
Now that we know how to formally state our hypothesis of independence, how do we test it? In the next lesson, we will dive into the Pearson chi-square test. You will learn how the test statistic is constructed by comparing the observed counts in your table to the counts you would expect to see if the null hypothesis were true.