Hello! Welcome back to our series on Categorical Data Analysis.
In our last lesson, we introduced the proportional odds model, the most common form of ordinal logistic regression. We learned that it's designed for outcomes with a natural order and that it works by modeling cumulative logits. The model's core structure is:
You'll recall that this model has separate intercepts () for each cut-point but, crucially, a single coefficient () for each predictor. This is the proportional odds assumption.
Today, we'll focus on the main goal for anyone using this model in practice: interpreting the coefficients () to understand the relationship between your predictors and the ordered outcome. We'll learn how to transform these coefficients into cumulative odds ratios and, more importantly, how to state their meaning clearly and intuitively.
1. The Challenge and the Strategy for Interpretation
Interpreting ordinal regression coefficients can be confusing at first. This is because of the way most statistical software (like R's polr package and Stata's ologit command) parameterizes the model with a negative sign before the coefficient.
This can lead to interpretations involving double negatives, which are hard to grasp. For instance, a positive coefficient means an increase in the predictor is associated with a decrease in the log-odds of being in a lower outcome category.
Fortunately, there is a much more straightforward way to think about and state this relationship. By slightly reframing the odds we are looking at, we can arrive at an interpretation that is both correct and easy to understand.
Let's dive into a resource that explains this strategy perfectly.
How do I interpret the coefficients in an ordinal logistic regression?
This FAQ from the UCLA Institute for Digital Research and Education is an excellent guide. It walks through the confusing, literal interpretation and then presents a much clearer, more intuitive alternative.
Please read the sections titled 'Another way to look at the odds ratio' and the 'Summary'. Focus on how they reframe the odds ratio to be about the odds of being in a higher category. This is the most common and intuitive way to report and understand your results.
To summarize the key insight from that reading:
If a predictor has a coefficient , the odds ratio is . The most intuitive way to interpret this is:
For a one-unit increase in , the odds of the outcome being in a higher category (versus a lower category) are multiplied by a factor of .
- If , then , and an increase in is associated with higher odds of being in a higher outcome category.
- If , then , and an increase in is associated with lower odds of being in a higher outcome category.
This single odds ratio applies across all possible splits of the outcome variable, due to the proportional odds assumption.
2. A Worked Example: Interpreting Model Output
Let's solidify this with the example from the reading and a video walkthrough. The model examines how parental education (pared, where 1 = at least one parent has a degree) predicts a student's likelihood of applying to college (apply, with categories: "unlikely", "somewhat likely", "very likely").
The video below shows the output from Stata and demonstrates how to interpret the coefficient for pared.
Ordinal regression Part 1: Introduction
This clip from the National Centre for Research Methods uses the same parental education example. Seeing the output and hearing the explanation will reinforce the interpretation strategy.
Please watch from 09:55 to 12:18. The presenter shows the Stata output, where the coefficient for pared is 1.127. They exponentiate this to get an odds ratio of 3.09 and provide the interpretation. Notice how their final summary matches our preferred method: 'the odds of being in a higher, rather than a lower category... are higher for students with educated parents.'
Based on the video, the interpretation is:
For students who have at least one parent with a degree, the odds of being in a higher application likelihood category (e.g., 'very likely' vs. 'somewhat or unlikely', OR 'very or somewhat likely' vs. 'unlikely') are 3.09 times the odds for students whose parents do not have a degree.
3. What About the Intercepts?
The model output also includes several intercepts, sometimes called thresholds or cut-points. While our primary focus is usually on the predictor coefficients (), it's important to know what these represent.
In short, the intercepts () are the estimated log-odds of being in category or below when all predictor variables are held at their baseline value (usually zero). They establish the baseline boundaries between the outcome categories.
R tutorial: Ordinal regression
This short clip from Prof Paul Christiansen gives a quick, clear explanation of these threshold coefficients.
Watch this brief clip from 12:18 to 13:00. The speaker explains that these thresholds represent the points on the logit scale where an individual is predicted to move from a lower to a higher set of categories.
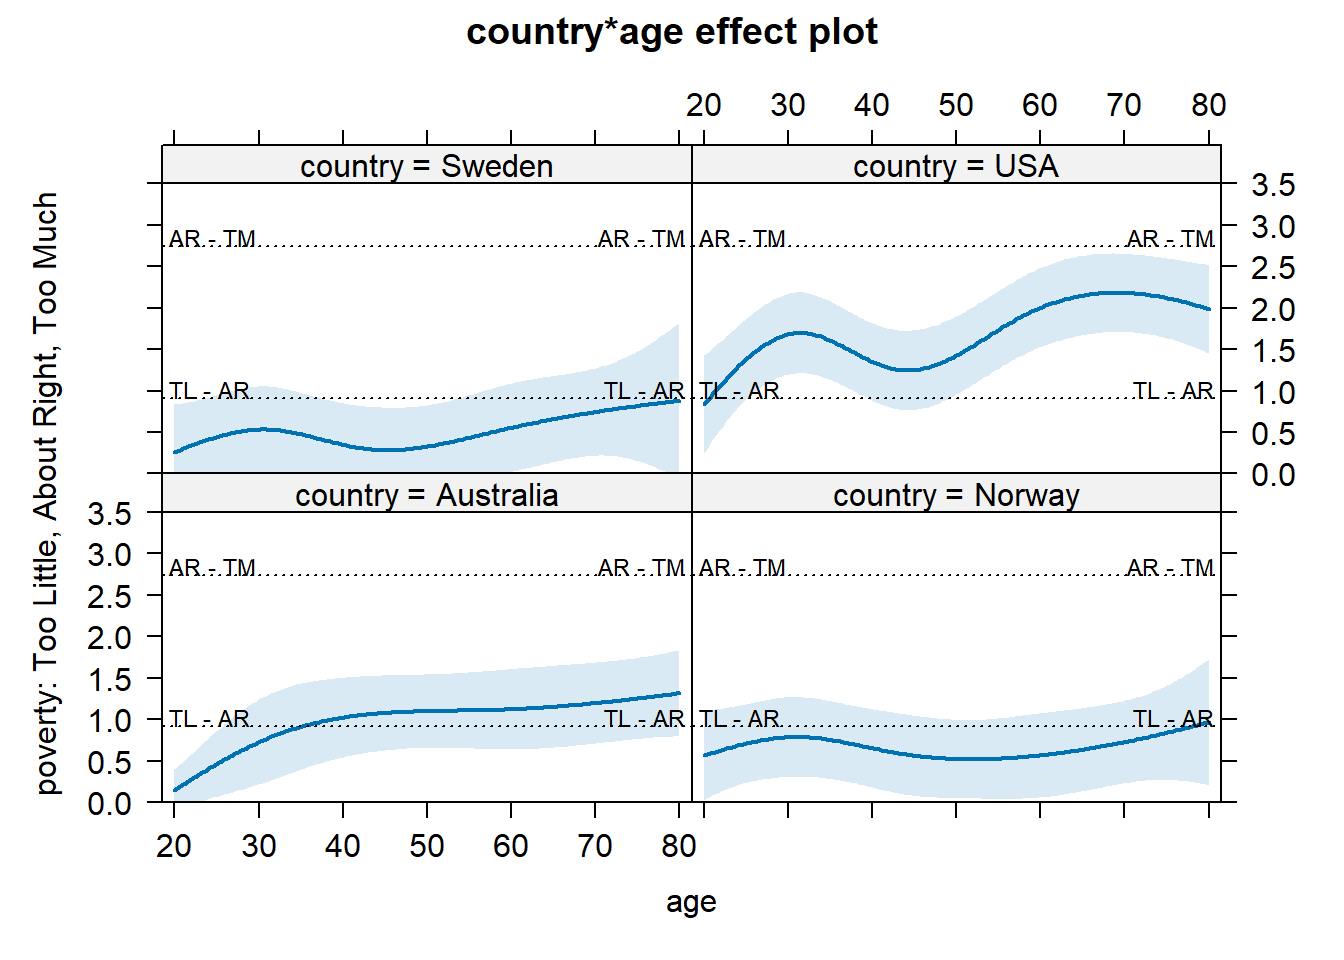
The intercepts define the locations of the parallel lines or planes that separate the outcome categories. The image below visualizes these thresholds (the horizontal dotted lines) for a model predicting perceptions of poverty based on age in different countries.
4. For Functional Understanding: From Odds Ratios to Probabilities
As you've emphasized, functional understanding is key. While odds ratios are the correct way to interpret the coefficients directly, they can be abstract. For communicating results to a broader audience, converting the model's output into predicted probabilities is often far more effective.
Using the full model—both the intercepts () and the slope ()—we can calculate the predicted probability of an individual falling into each specific outcome category, given their values on the predictor variables.
The process involves two steps:
- Calculate the cumulative probabilities for each cut-point.
- Use subtraction to find the probability for each individual category: .
The next segment of the video demonstrates this calculation and shows how to present the results in a simple, powerful table.
Ordinal regression Part 1: Introduction
Let's finish the NCRM video to see how to translate our model into more tangible predicted probabilities.
Watch from 12:18 to the end (16:30). Follow the process of calculating the cumulative probabilities first, and then finding the individual category probabilities by subtraction. The final table comparing probabilities for the two groups is a very clear and effective way to present the model's findings.
Presenting a table showing that students with educated parents have a 21% chance of being "very likely" to apply, compared to only 8% for students without educated parents, is a much more direct way to communicate the practical significance of the predictor.
Conclusion
In this lesson, we focused on the practical interpretation of coefficients from an ordinal logistic regression model. You learned a clear strategy to navigate the potential confusion caused by model parameterization and how to communicate your findings effectively.
Key Takeaways:
- Main Interpretation Strategy: To interpret a coefficient , exponentiate it to get the odds ratio . This value represents the multiplicative change in the odds of being in a higher outcome category for a one-unit increase in the predictor.
- Positive vs. Negative Coefficients: A positive () means the predictor is associated with higher levels of the outcome. A negative () means the predictor is associated with lower levels of the outcome.
- Intercepts are Thresholds: The intercepts () represent the baseline cut-points between the ordered categories on the log-odds scale.
- Communicate with Probabilities: While odds ratios are the direct interpretation, calculating and presenting predicted probabilities for each outcome category is often the most intuitive way to convey the model's practical implications.
Preview of the Next Lesson:
The entire interpretation we learned today hinges on the proportional odds assumption—the idea that is the same across all category splits. But what if this assumption is wrong? In our next lesson, we will learn how to state and test the proportional odds assumption and discuss what to do if the test reveals a problem.