Introduction
In our last lesson, we defined confounding and saw how it can dangerously distort the relationship between an exposure and an outcome, leading to phenomena like Simpson's Paradox. We learned that a confounder is associated with both the exposure and the outcome, and that failing to account for it can make us see an association that isn't there, or miss one that is.
Today, we move from defining the problem to detecting it. This lesson addresses the learning outcome: Use stratification to identify the presence of confounding in contingency table analysis. We will learn the fundamental technique of stratification, which involves breaking our data into subgroups to see if the confounder is skewing our overall results. This is the practical, hands-on method for checking the theoretical criteria we discussed previously.
By the end of this lesson, you will be able to dissect a dataset, control for a potential confounder using stratification, and compare the overall (crude) association with the subgroup-specific (stratified) associations to make a judgment about whether confounding is present.
1. The Logic of Stratification: Marginal vs. Partial Tables
The core idea of stratification is simple: if we suspect a variable is confounding our analysis, we can temporarily remove its influence by looking at the data within specific levels, or strata, of that variable. For example, if we think age is a confounder in a study of a new drug, we would analyze the data separately for "young patients," "middle-aged patients," and "old patients."
This process introduces some important terminology for the tables we create. A brief reading from a practical guide to the Cochran-Mantel-Haenszel test will help us define these terms.
Introduction to the Cochran-Mantel-Haenszel Test
This guide from the R CRAN repository uses the famous Titanic dataset to explain how we structure data for a stratified analysis. It provides clear definitions for the types of tables we will be working with.
Please read the sections titled 'Partial and Marginal Tables' and 'Conditional, Marginal, and Common Odds Ratios'. Focus on understanding the difference between: A marginal table, which ignores the third variable (e.g., survival by sex, ignoring passenger class). Partial tables, which show the association at each level of the third variable (e.g., survival by sex within 1st class, 2nd class, etc.). The marginal odds ratio (calculated from the marginal table) vs. the conditional odds ratios (calculated from each partial table).
To summarize the key ideas from that reading:
- The marginal table gives us the crude measure of association. This is the overall relationship we observe before accounting for any potential confounders.
- The partial tables give us stratum-specific measures of association. Each one shows the relationship within a single, more homogeneous subgroup.
- If a variable is a confounder, the crude odds ratio from the marginal table will be a distorted summary of the true association, which is better represented by the conditional odds ratios from the partial tables.
2. The Process: How to Identify Confounding
Now that we have the right terminology, how do we use these tables to formally identify confounding? The process is a direct comparison.
Let's watch a short video that illustrates this with a clear example. In the previous lesson, we saw examples where confounding created a spurious association. Here, we'll see stratification used to reveal that the initial association was indeed false.
Confounding vs Effect Modification I Simplest Explanation, with Questions
This video from Acing Medicine demonstrates how an apparent association between alcohol and lung cancer completely disappears once the data is stratified by smoking status, revealing smoking as the true confounder.
Watch from the beginning of the example (00:25) to the summary of confounding (03:08). Notice how the strong odds ratio in the overall group vanishes (becomes 1.0) inside both the 'smokers' and 'non-smokers' strata.
The video demonstrates the most extreme case of confounding: an association that is entirely explained away. In practice, the effect is often more subtle. The general process for identification is summarized in the diagram below.
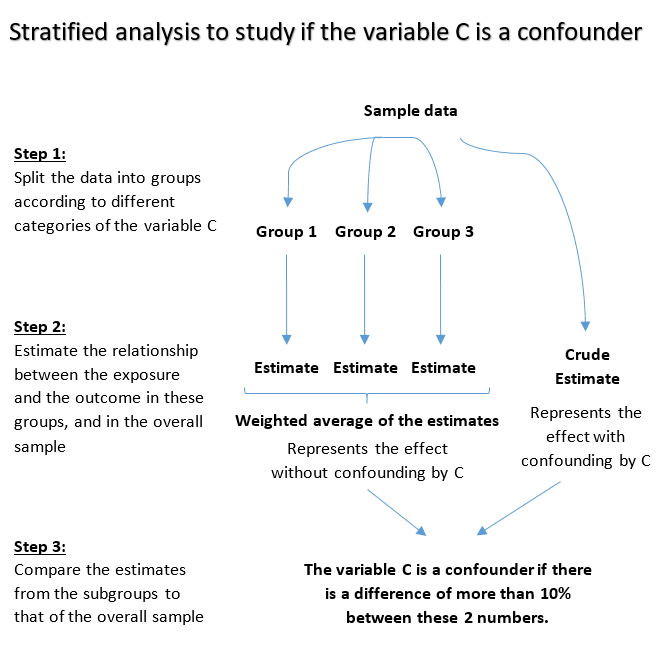
So, the key question is: how different do the crude and adjusted measures have to be?
While there is no universal cutoff, a common rule of thumb in epidemiology is that confounding is present if the crude and adjusted estimates differ by more than 10-20%.
The flowchart below illustrates this decision process. The "adjusted" measure (like for the Mantel-Haenszel odds ratio, which we'll cover soon) is a summary of the stratum-specific odds ratios.

The percentage change is typically calculated as:
3. A Detailed Numerical Example
Let's walk through a complete example to see this process in action with real numbers. The following video analyzes data from a cohort study to see if age confounds the relationship between sex and mortality.
This video will also introduce the Mantel-Haenszel adjusted rate ratio, which is a weighted average of the stratum-specific rate ratios. Think of it as the "summary" measure of association after controlling for the confounder.
Week 9 : CONFOUNDING: MANTEL HAENSZEL
This video from Data Learner provides a step-by-step calculation of a crude rate ratio, stratum-specific rate ratios, and the final Mantel-Haenszel adjusted rate ratio. It's a perfect demonstration of the comparison we've been discussing.
Watch the section from 12:25 to 22:43. Follow along as the presenter does the following: Calculates the crude rate ratio (men vs. women) for mortality (Result: 1.1). Stratifies the data by age (young vs. old) and calculates the stratum-specific rate ratios (Results: 1.57 and 1.49). Calculates the Mantel-Haenszel adjusted rate ratio, which is the summary measure controlling for age (Result: 1.5). Compares the crude (1.1) and adjusted (1.5) measures to conclude that age is indeed a confounder.
Let's recap the findings from the video:
- Crude Rate Ratio: 1.1
- Adjusted Rate Ratio: 1.5
The crude analysis suggested a very small (10%) increase in mortality risk for men. However, after adjusting for age, the analysis showed a much larger (50%) increase in risk. The crude measure was heavily biased towards the null value of 1.0.
Using our rule of thumb:
Since 26.7% is well above the 15-20% threshold, we have strong evidence of confounding. The crude measure is misleading, and the adjusted measure should be reported.
4. When Stratification Fails
You rightly pointed out that knowing the limitations of a method is crucial. Stratification is intuitive and powerful, but it has a significant practical weakness.
The same video you just watched concludes with a discussion of this very point.
Week 9 : CONFOUNDING: MANTEL HAENSZEL
The final part of the 'CONFOUNDING: MANTEL HAENSZEL' video explains the primary limitation of stratification as a method for controlling confounding.
Please watch from 22:43 to the end (24:41). Focus on the problem that arises when you try to control for multiple confounders simultaneously.
The key limitation is data sparsity.
- To control for one binary confounder, you create two strata.
- To control for two binary confounders, you need strata.
- To control for three, you need 8 strata, and so on.
As you create more and more strata, you spread your data thinner and thinner. Eventually, the number of individuals in each stratum becomes so small that you can no longer get reliable estimates of the odds ratio or rate ratio within those strata.
This is the primary reason why, in practice, multivariable regression models (like the logistic and Poisson regression models we will study later) are often preferred. They can mathematically adjust for many confounders simultaneously without needing to physically split the data into dozens of tiny subgroups.
Conclusion
In this lesson, we put the theory of confounding into practice. We learned how to use stratification not just as a conceptual tool, but as a direct analytical method to detect the presence of confounding in a dataset.
Key Takeaways:
- Stratification is the process of splitting data into subgroups (strata) based on the levels of a potential confounding variable.
- We can identify confounding by comparing the crude measure of association (calculated from the overall, or marginal, table) with an adjusted measure of association (a weighted average of the stratum-specific measures).
- A substantial difference between the crude and adjusted measures (e.g., >10-20%) is evidence of confounding, indicating the crude measure is biased.
- The main limitation of stratification is data sparsity: it becomes impractical when you need to control for several confounders at once, as the strata become too small.
Preview of the Next Lesson:
We have now seen how to use stratification to identify confounding by comparing crude and adjusted measures. The next logical step is to formalize this process. In the next lesson, we will learn about the Cochran-Mantel-Haenszel (CMH) test. This test allows us to formally test the null hypothesis of no association between an exposure and an outcome after controlling for a confounder across multiple strata. We will also look more closely at how the Mantel-Haenszel summary odds ratio is calculated and interpreted.