Hello! Welcome to the fifth lesson in our module on transforming data with PySpark DataFrames.
In our last lesson, we focused on row-level transformations. You learned how to add or modify columns with withColumn() and how to order your entire dataset using orderBy(). These are fundamental skills for preparing and shaping your data.
Today, we shift our focus from individual rows to groups of rows. We'll explore how to summarize data by applying aggregate functions after a groupBy operation. This is one of the most powerful features in data processing, allowing you to move from raw, detailed records to insightful summary statistics. For example, you might want to calculate the total sales per store, the average exam score per class, or the number of user events per day. This lesson will equip you with the tools to perform these crucial calculations.
1. The Concept of Grouping and Aggregation
Before we dive into the code, let's establish the core idea. The process involves two main steps:
- Grouping: Partitioning the rows of a DataFrame into groups based on the values in one or more columns. All rows with the same value in the grouping column(s) are put into the same group.
- Aggregating: Applying a function to each group to compute a single summary value. This could be a count of rows, a sum of values, an average, etc.
The image below provides a simple, clear illustration of this process.
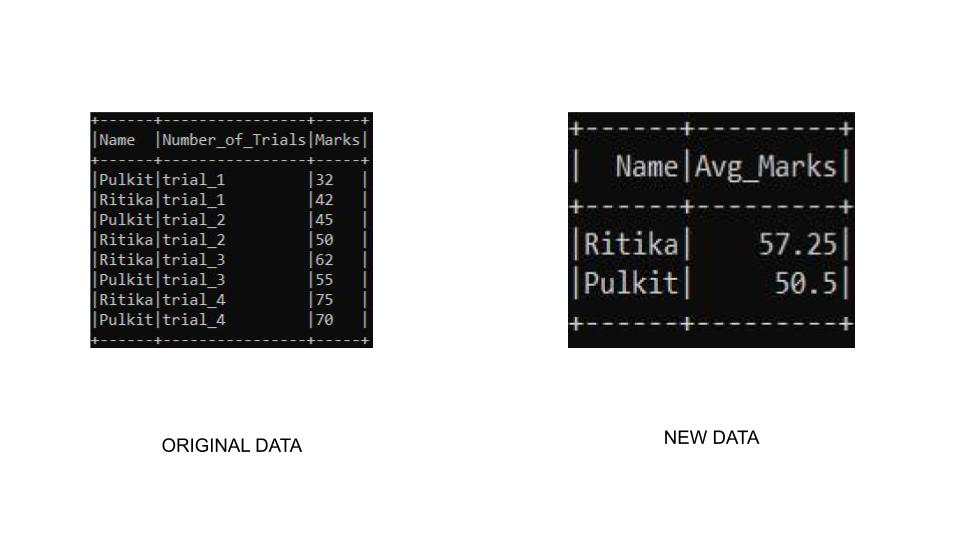
In PySpark, the groupBy() method handles the first step. It doesn't perform a calculation itself but returns a GroupedData object, which is essentially the DataFrame organized into groups, ready for an aggregation.
2. Performing Single Aggregations
Once you have a GroupedData object, you can apply an aggregate function to it. The most common functions are imported from pyspark.sql.functions, including count(), sum(), avg() (average), min(), and max().
Let's watch a video that demonstrates how to apply these functions one at a time.
Tutorial 5- Pyspark With Python-GroupBy And Aggregate Functions
This video from Krish Naik provides a clear, step-by-step demonstration of grouping a DataFrame and then applying various aggregate functions.
Please watch the following segments. Notice the pattern: first groupBy(), then an aggregate function like .sum() or .count(), and finally .show() to display the result. Grouping and Summing: (00:03:12 - 00:07:03) - Shows how to group by 'name' and 'departments' and calculate the sum of salaries. Calculating the Mean: (00:06:53 - 00:07:31) - Demonstrates using .mean() to find the average salary per department. Counting Group Members: (00:07:22 - 00:08:06) - Explains how to use .count() to find the number of employees in each department. Finding Max and Min: (00:08:47 - 00:10:23) - Covers the use of .max() and .min().
As you saw, the syntax is quite intuitive:
from pyspark.sql.functions import sum, avg, count, min, max


# Group by the 'department' column
grouped_df = df.groupBy("department")


# Calculate the average salary for each department
avg_salary_per_dept = grouped_df.avg("salary")


# Calculate the total number of employees per department
employee_count_per_dept = grouped_df.count()


# Show the results
avg_salary_per_dept.show()
employee_count_per_dept.show()
While this works, performing a separate groupBy operation for each aggregation is inefficient. A much better approach is to calculate all the aggregations you need at once.
3. Performing Multiple Aggregations with agg()
The agg() method is the standard and most efficient way to apply multiple aggregate functions to a GroupedData object. You can pass multiple aggregate function calls into agg(), and it will compute them all in a single pass over the data.
It's also best practice to give your new aggregated columns clear names using the .alias() method.
This next video focuses specifically on using agg() to perform multiple calculations.
26. GroupBy agg() function in PySpark | Azure Databricks #spark #pyspark #azuredatabricks #azure
This tutorial from WafaStudies demonstrates how to use the .agg() function to apply multiple aggregations simultaneously, which is the preferred method.
Watch the segment from 00:04:55 to 00:07:52. Pay close attention to how the count(), min(), and max() functions are imported and then used inside the .agg() call. Note the use of .alias() to rename the resulting columns.
To reinforce this concept, the following article provides excellent code examples for various scenarios.
PySpark Groupby Agg (aggregate) - Explained
The article "PySpark Groupby Agg (aggregate) - Explained" from Spark By {Examples} is a great reference for different aggregation patterns.
Please read sections 2, 3, and 4. They cover: Section 2: Grouping by multiple columns (department and state). Section 3: Running multiple aggregates at once (the core of what we're learning). Section 4: Filtering the results of an aggregation using .where(), which is analogous to SQL's HAVING clause.
Here's a summary of the powerful pattern you just learned:
from pyspark.sql.functions import sum, avg, max, col


# Group by one or more columns, then apply multiple aggregations
summary_df = df.groupBy("department", "state") \
               .agg(
                   sum("salary").alias("total_salary"),
                   avg("salary").alias("avg_salary"),
                   max("bonus").alias("max_bonus")
               )


# You can even filter the aggregated results
high_bonus_depts = summary_df.where(col("max_bonus") > 20000)

high_bonus_depts.show()
This ability to group, aggregate, and then filter is a cornerstone of data analysis and is frequently tested on the certification exam.
4. Hands-On Exercise
Let's apply these aggregation techniques to our baby names dataset. Please set up your Databricks notebook with the same code from our previous lesson to load and clean the data.
# Step 1: Set up paths (replace with your catalog/schema/volume)
catalog = "your_catalog_name"
schema = "your_schema_name"
volume = "your_volume_name"
path_volume = f"/Volumes/{catalog}/{schema}/{volume}"
file_name = "baby_names.csv"


# Step 2: Load the data into a DataFrame
df = spark.read.csv(f"dbfs:{path_volume}/{file_name}",
  header=True,
  inferSchema=True,
  sep=",")


# Step 3: Clean up column names for easier use
df_clean = df.withColumnRenamed("First Name", "FirstName") \
             .withColumnRenamed("Sex", "Gender")


# Let's see our starting point
df_clean.select("FirstName", "Gender", "Count", "Year").show(5)
Your Tasks:
- Popularity Analysis: For each unique
FirstName, calculate the following:- The total number of babies given that name across all years (
total_count). - The number of distinct years the name appears in the dataset (
num_years). - The first year the name appeared (
first_year). - The most recent year the name appeared (
last_year).
- The total number of babies given that name across all years (
- Filter and Sort: From the result of your aggregation, create a new DataFrame that only includes names with a
total_countgreater than 50,000. - Display Results: Sort the filtered DataFrame to show the names with the highest
total_countat the top, and display the top 20 results.
Solution Walkthrough:
Try to solve the exercise on your own before reviewing the solution.
from pyspark.sql.functions import sum, countDistinct, min, max, col


# Task 1: Perform the aggregation
name_summary_df = df_clean.groupBy("FirstName") \
    .agg(
        sum("Count").alias("total_count"),
        countDistinct("Year").alias("num_years"),
        min("Year").alias("first_year"),
        max("Year").alias("last_year")
    )

print("Aggregated summary for each name:")
name_summary_df.show(5)


# Task 2: Filter for names with a total count greater than 50,000
popular_names_df = name_summary_df.where(col("total_count") > 50000)

print("\nFiltered popular names (total_count > 50,000):")
popular_names_df.show(5)


# Task 3: Sort by total_count descending and display the top 20
print("\nTop 20 most popular names:")
popular_names_df.orderBy(col("total_count").desc()).show(20)
Conclusion
Great job! You have now mastered one of the most important transformations in data engineering: summarizing data using groupBy and agg. This skill is essential for everything from creating analytical reports to building features for machine learning models.
Key Takeaways
- The
groupBy()method partitions a DataFrame into groups based on specified columns. - Aggregate functions like
sum(),avg(),count(),min(), andmax()compute a single summary value for each group. - The
agg()method is the most efficient way to apply multiple aggregate functions at once. - Always use
.alias()withinagg()to give your summary columns meaningful names. - You can chain
.where()or.filter()after an aggregation to filter groups based on a summary statistic, similar to SQL'sHAVINGclause.
Next Steps
So far, we've focused on transforming a single DataFrame. However, real-world data is often spread across multiple tables. In our next lesson, we will learn how to join DataFrames using different join types. This will allow you to combine data from different sources before performing the kinds of filtering, transformation, and aggregation you've already learned.