Hello! Welcome to the final lesson in our module on Delta Live Tables.
In our last session, we covered how to configure a DLT pipeline's destination, specifying the target schema and storage location using both the UI and code-level overrides. We now know how to define what a pipeline does, when it runs, and where it stores its output. The next critical skill is understanding what happens during a run.
This lesson focuses on observability. By the end of our session, you will be able to monitor pipeline runs and interpret the DLT event log for troubleshooting. Mastering this is essential for building and maintaining reliable, production-grade data pipelines.
Monitoring Pipeline Runs: The UI Overview
The first place to check on your pipeline's health is the DLT user interface. It provides a high-level, visual summary of your pipeline's structure and its most recent run.
When you open a DLT pipeline in Databricks, you are presented with several key components for monitoring:
- The DAG (Directed Acyclic Graph): A visual flowchart of your tables and the dependencies between them.
- Run History: A dropdown menu to switch between the current run and previous historical runs.
- Data Quality Metrics: Each node on the DAG displays the percentage of records written versus those dropped due to failing data quality expectations.
- Event Log Panel: A tab at the bottom of the screen that shows a raw stream of events from the pipeline's execution.
This image gives you a great sense of what the DLT interface looks like during a run.
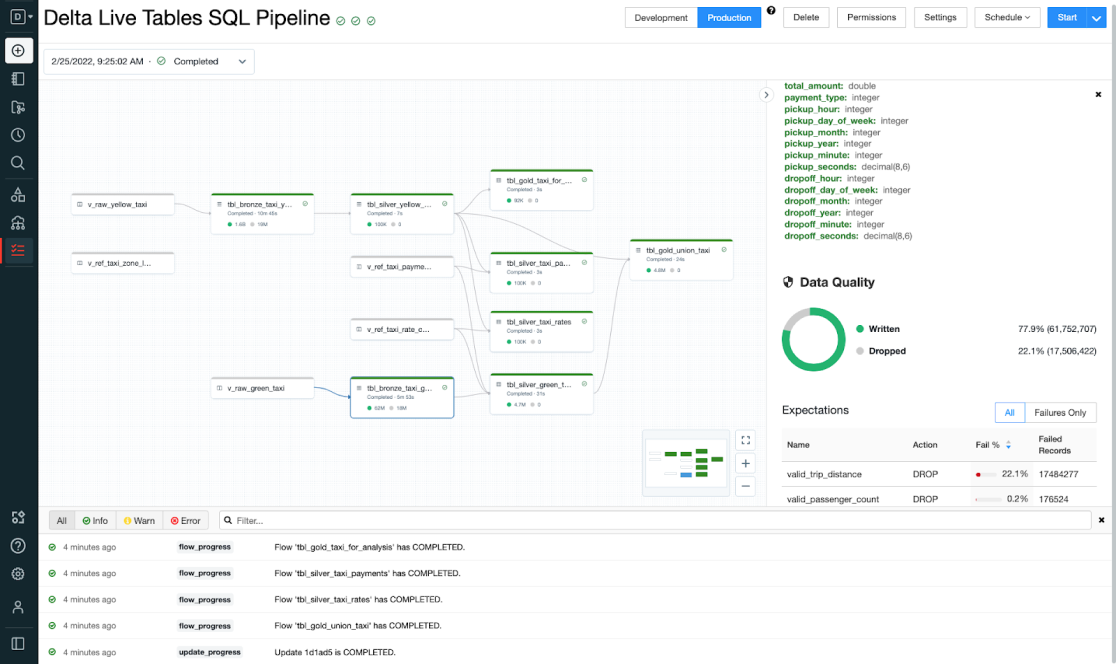
This UI is your first stop for a quick health check. You can immediately see if a run succeeded or failed and spot which tables had data quality issues.
The DLT Event Log: Your Source of Truth
While the UI is excellent for a quick overview, all serious monitoring and troubleshooting happens by querying the DLT event log.
Every action, metric, and outcome in a DLT pipeline—from a user starting an update to a data quality rule failing—is recorded in an event log. Crucially, this log is stored as a Delta table. This powerful design choice means you can use standard SQL to perform deep analysis, create alerts, and build custom monitoring dashboards.
Let's watch a short video that introduces this concept.
DLT Overview: Modern Software Engineering for ETL Processing
This clip from a Databricks video explains what the event log is and emphasizes that it's a queryable Delta table, which is the foundation for all monitoring activities.
Watch from 12:15 to 12:49. Pay close attention to the statement that 'every event is captured' and that the log is stored as a Delta table, allowing for any type of analysis.
Querying the Event Log
Databricks provides a special table-valued function, event_log(), to query the logs for a specific pipeline. The only argument it needs is the Pipeline ID, which you can copy directly from the DLT UI.
Let's see a practical demonstration of how to start querying the event log from a notebook.
30 DLT Data Quality & Expectations | Monitor DLT pipeline using SQL | Define DQ rule |Observability
This video from Ease With Data demonstrates the fundamental process of querying the event log using the event_log() function in a Databricks notebook.
Watch from 14:57 to 15:51. Observe how the Pipeline ID is retrieved from the UI and used within the SELECT * FROM event_log('<pipeline_id>') query.
This simple query gives you the raw, detailed history of your pipeline.
-- The basic query to access all events for a pipeline
SELECT * FROM event_log('YOUR_PIPELINE_ID');
While SELECT * is a good starting point, the real power comes from writing more specific queries to extract meaningful information.
Understanding the Event Log Schema
To write effective queries, you need a basic understanding of the event log's structure. You don't need to memorize it, but you should know where to find the key information.
The event log has several top-level columns like timestamp, event_type, level (INFO, WARN, ERROR), and message. However, the most important column is details, a JSON string that contains structured information specific to each event_type.
For an in-depth reference, you can use the official Databricks documentation.
This official documentation page describes the complete schema of the DLT event log. It's an essential reference for advanced troubleshooting.
Skim through this document. You don't need to read every detail. Instead, focus on understanding the purpose of these key event types and objects: PipelineEvent object: The top-level structure. details object: The main container for structured data. flow_progress event: Tracks the status, metrics, and data quality of a single data flow (table). update_progress event: Tracks the overall status of the entire pipeline update. DataQualityMetrics and ExpectationMetrics objects: Contain the counts of passed and failed records for your data quality rules.
The key takeaway is that you'll often be querying for specific event_type values (like flow_progress) and then parsing the details JSON column to get the metrics you need. Databricks SQL uses a colon (:) syntax for easy navigation of JSON fields (e.g., details:flow_progress:status).
Practical Troubleshooting with SQL Queries
Now, let's put this knowledge into practice with some common monitoring and troubleshooting scenarios. The following guide provides excellent, ready-to-use queries for this purpose.
Databricks: hands-on tutorial for DLT Data Quality & Expectations
This hands-on tutorial provides a set of practical SQL queries for monitoring DLT pipelines, covering operational health, data quality, and general troubleshooting tips.
Read the sections 'How to Monitor DLT pipelines (Observability)', 'Practical guidance & patterns', and 'Troubleshooting'. Pay close attention to the SQL queries provided. We will discuss them next.
Let's break down the most important queries from that guide.
1. Troubleshooting Errors
When a pipeline fails, the first step is to find the error message. You can do this by filtering the event log for events with a level of ERROR.
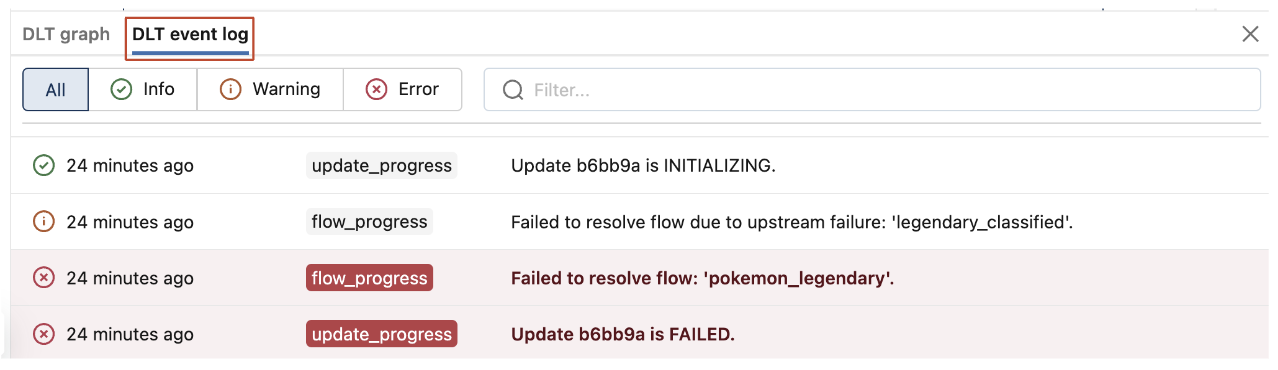
In SQL, the query is simple:
SELECT
  timestamp,
  message
FROM event_log('YOUR_PIPELINE_ID')
WHERE level = 'ERROR'
ORDER BY timestamp DESC;
The message column will often contain a human-readable explanation of what went wrong, such as a syntax error in your code or an inability to access a source table.
2. Monitoring Operational Health
To understand pipeline performance, you can query flow_progress events. These events tell you the status of each table (flow) in your pipeline and provide key metrics like the number of input and output rows.
This query, adapted from the resource, summarizes the latest status of each table in your pipeline:
-- Summarize task status and row counts
SELECT
  id:flow_definition.output_dataset::string AS dataset,
  details:flow_progress:status::string AS status,
  details:flow_progress:metrics:num_output_rows::long AS output_rows,
  timestamp
FROM event_log('YOUR_PIPELINE_ID')
WHERE event_type = 'flow_progress'
ORDER BY timestamp DESC;
This helps you track how much data is being processed by each step and identify potential bottlenecks.
3. Monitoring Data Quality
The event log is also where you can track the performance of your data quality expectations. The flow_progress event contains a nested JSON structure with details about passed and failed records for each expectation.
The following query extracts and summarizes these data quality failures. It's a powerful example of how you can parse the nested JSON to build a detailed report.
-- Summarize data quality failures by dataset and rule
SELECT
  details:flow_progress:dataset::string AS dataset,
  explode(from_json(details:flow_progress:data_quality:expectations, 'array<struct<name:string, dataset:string, passed_records:long, failed_records:long>>')) AS expectation
FROM event_log('YOUR_PIPELINE_ID')
WHERE event_type = 'flow_progress' AND details:flow_progress:data_quality:dropped_records > 0;
This query uses explode to unpack the array of expectations within the data_quality object, giving you a row for each rule that was evaluated. The results allow you to see exactly which rules are failing and for which datasets.
As you saw in the resources, these queries can be used to create views for easier access or even power real-time dashboards for continuous monitoring.
Conclusion
Congratulations on completing the module on Delta Live Tables! You are now equipped with the knowledge to build, configure, and, most importantly, monitor robust data pipelines.
Key Takeaways
- UI for High-Level Monitoring: The DLT UI provides a visual DAG and quick metrics, perfect for an initial health check.
- Event Log for Deep Dives: The DLT event log is the definitive source of truth, stored as a Delta table that you can query with SQL.
event_log()Function: UseSELECT * FROM event_log('<pipeline_id>')to access the raw event data.- Interpreting Events: You can troubleshoot failures by filtering for
level = 'ERROR'. You can monitor performance and data quality by queryingflow_progressevents and parsing thedetailsJSON column. - Structured Queries: Use specific queries to track operational health (e.g., row counts, status) and data quality metrics (e.g., passed/failed records per expectation).
Next Steps
In this module, you've mastered the art of building a single, declarative data pipeline. In the real world, you'll often need to connect multiple pipelines and other tasks into a cohesive workflow. Our next module, Orchestrating Production Workflows, will teach you how to use Databricks Jobs to schedule, chain together, and manage these complex, multi-task workflows in a production environment.