Hello! Welcome to the fifth lesson in our module on Delta Live Tables.
In our last lesson, you learned how to implement a DLT pipeline using Python decorators. We saw how to define tables and views as Python functions returning Spark DataFrames, effectively building a medallion architecture with @dlt.table and @dlt.view.
Today, we'll build on that foundation by focusing on a critical aspect of any production pipeline: data quality. It’s not enough to just transform data; we must also ensure it's accurate, complete, and reliable. In DLT, this is achieved through Expectations. By the end of this lesson, you will be able to apply expectations to DLT tables to enforce and monitor data quality.
What are DLT Expectations?
An expectation is a declarative rule that you apply to a dataset to ensure data quality. You can think of it as a quality checkpoint. For every record that flows through your pipeline, DLT checks if it meets the defined expectations.
An expectation consists of two parts:
- A constraint: A rule expressed as a boolean (true/false) condition (e.g.,
order_id IS NOT NULL). - An action: What to do when a record violates the constraint.
This flow is nicely illustrated in the following diagram:
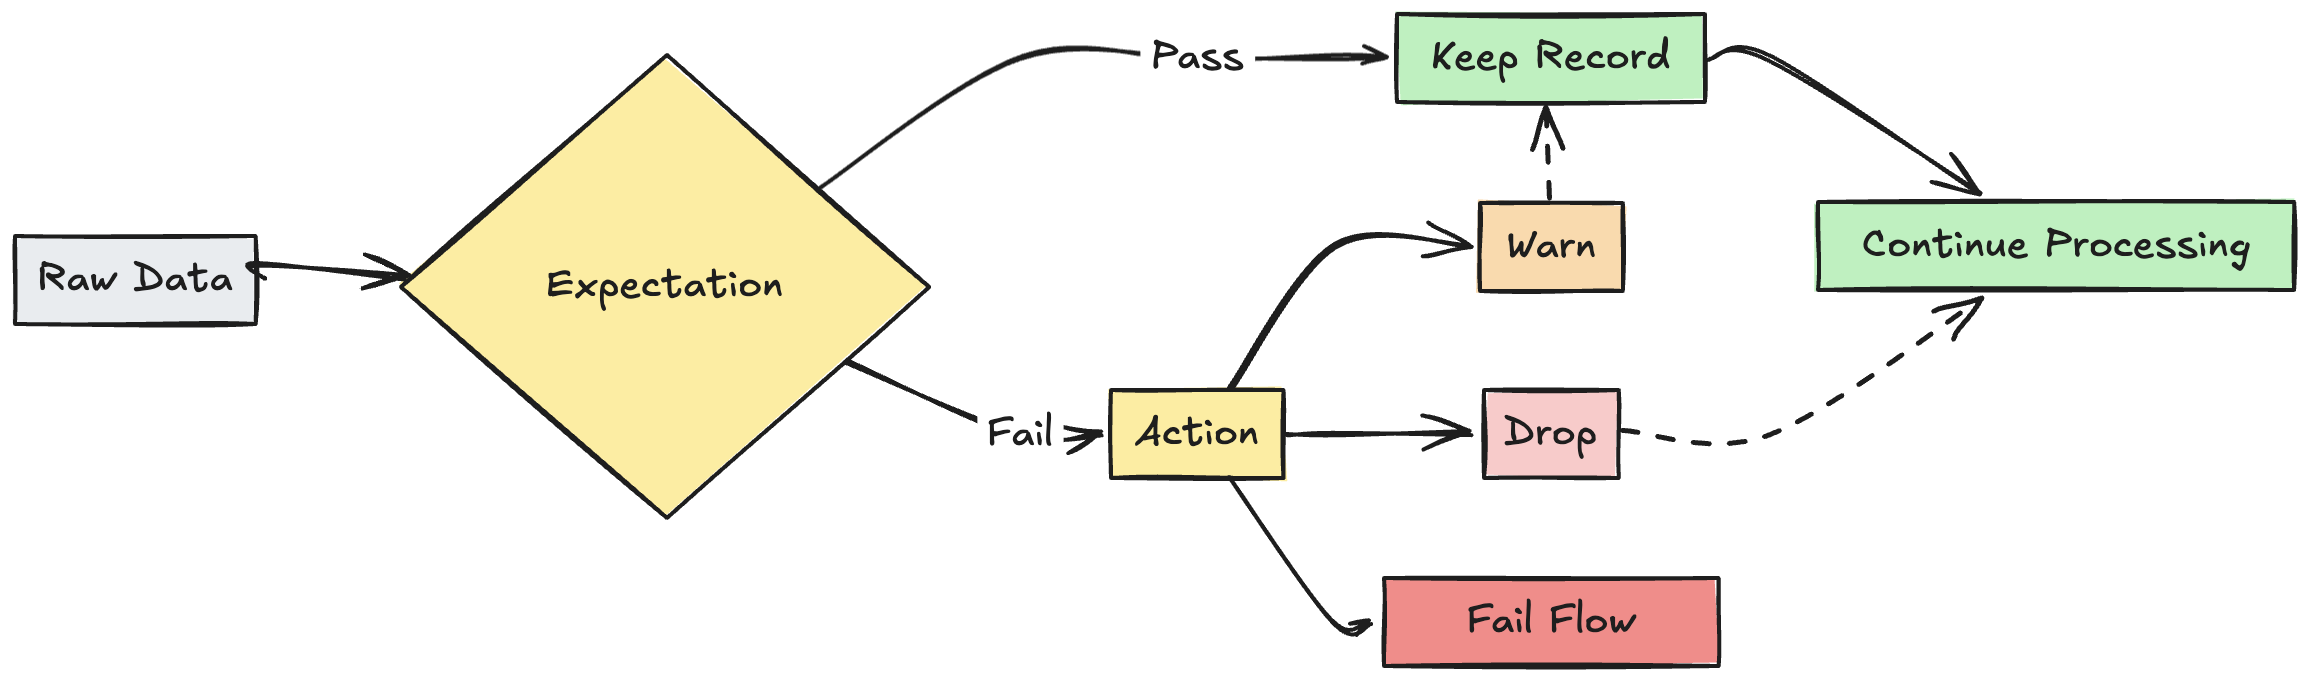
As you can see, DLT gives you precise control over how to handle data that doesn't meet your quality standards.
Defining and Applying Expectations in Python
In the previous lesson, we used the @dlt.table decorator. To add data quality checks, we simply add expectation decorators to the same function.
A best practice is to define your rules separately as a Python dictionary. This makes your rules reusable and easier to manage. Let's see how.
import dlt


# A dictionary to hold our data quality rules
order_rules = {
  "valid_order_status": "order_status IN ('O', 'F', 'P')",
  "valid_order_price": "order_price > 0"
}
Here, the dictionary keys are the names of our expectations, and the values are the constraint expressions written as SQL strings.
To apply these rules, you use an expectation decorator. If you have multiple rules in a dictionary, you'll use @dlt.expect_all. Let's watch a short video that introduces this concept.
30 DLT Data Quality & Expectations | Monitor DLT pipeline using SQL | Define DQ rule |Observability
This clip from Ease With Data introduces the concept of DLT expectations and demonstrates how to define reusable rules in a Python dictionary.
Please watch from the beginning to 03:18. Pay close attention to how the rules for orders and customers are defined in separate dictionaries. This is the foundation for everything we'll do next.
Now that you've seen how to define rules, let's explore the three actions you can take when a rule is violated.
The Three Expectation Actions
DLT offers three ways to handle records that fail a quality check. Your choice depends on the severity of the data issue and the requirements of your pipeline.
Let's explore each one. For this, we'll use a textual resource that clearly lays out the syntax and use cases for each action.
Databricks: hands-on tutorial for DLT Data Quality & Expectations
This article from DataOps School provides clear, concise explanations and code examples for each expectation action. It's a great reference to have.
Please read the section titled 'What are Expectations in Databricks DLT?'. Focus on the definitions of the three actions: Warning, Drop, and Fail.
1. Warn (The Default Action)
The Warn action (also referred to as Allow) is the most permissive. When a record fails the expectation, DLT:
- Records the failure.
- Allows the record to continue processing into the target table.
This is the default behavior if you don't specify another action. It's perfect for profiling new data sources or for rules that are "good to know" but not critical enough to stop the pipeline or drop data.
Here's how you'd apply our order_rules in warning mode:
import dlt

order_rules = {
  "valid_order_status": "order_status IN ('O', 'F', 'P')",
  "valid_order_price": "order_price > 0"
}

@dlt.table(comment="Bronze table for orders, with warnings.")
@dlt.expect_all(order_rules) # Default action is Warn
def orders_bronze():
  return spark.readStream.table("source.orders_raw")
The decorator @dlt.expect_all() applies all rules from the order_rules dictionary. Because we haven't specified _or_drop or _or_fail, it defaults to warning.
Let's see this in action.
30 DLT Data Quality & Expectations | Monitor DLT pipeline using SQL | Define DQ rule |Observability
This segment demonstrates applying an expectation with the default 'Warning' action. Notice how bad records are flagged in the metrics but still get processed.
Watch the video from 03:18 to 06:20. You'll see how @dlt.expect_all is added to the code and how the pipeline UI reflects the data quality checks after a run.
2. Fail (The Strictest Action)
The Fail action is for your most critical data quality rules. When a record fails an expectation with this action, DLT:
- Records the failure.
- Immediately stops the pipeline update.
This ensures that no data is processed beyond the point of failure, preventing bad data from corrupting downstream tables. This is essential for pipelines with strict data contracts or SLAs.
To enforce this, you use the @dlt.expect_all_or_fail decorator.
@dlt.table(comment="Bronze table that fails on bad data.")
@dlt.expect_all_or_fail(order_rules)
def orders_bronze_strict():
  return spark.readStream.table("source.orders_raw")
The video below shows what happens when you run a pipeline with this strict constraint.
30 DLT Data Quality & Expectations | Monitor DLT pipeline using SQL | Define DQ rule |Observability
Here, you'll see the 'Fail' action demonstrated. The pipeline stops as soon as it encounters a record that violates the rules.
Watch from 08:54 to 10:19. Observe how the pipeline graph shows a 'Failed' state and how the event log points to the exact expectation that caused the failure.
3. Drop (The Filter Action)
The Drop action provides a middle ground. When a record fails an expectation, DLT:
- Records the failure.
- Silently discards the failing record.
- Continues processing the valid records.
This is useful when you want to filter out malformed or irrelevant records without halting the entire pipeline.
To implement this, you use the @dlt.expect_all_or_drop decorator.
@dlt.table(comment="Bronze table that drops bad records.")
@dlt.expect_all_or_drop(order_rules)
def orders_bronze_clean():
  return spark.readStream.table("source.orders_raw")
Let's see the practical outcome of using the drop action.
30 DLT Data Quality & Expectations | Monitor DLT pipeline using SQL | Define DQ rule |Observability
This final demonstration covers the 'Drop' action. Watch how invalid records are counted as 'dropped' in the metrics, and only valid data makes it into the target table.
Watch from 10:19 to 11:36. Pay attention to the 'Data quality' metrics in the UI, which now show the number of records written versus the number dropped.
Monitoring Data Quality
Applying expectations is only half the story. You also need to monitor the results. DLT provides two primary ways to do this.
1. The Pipeline Details UI
As you saw in the videos, the DLT graph UI provides immediate feedback on data quality. When you select a table in the graph, the details panel shows a Data quality section with metrics on passing, failing, and dropped records for each expectation.

2. The Event Log
For more advanced monitoring, alerting, and historical analysis, DLT records all pipeline events into a Delta table called the event log. Since it's a table, you can query it with SQL to create powerful observability dashboards.
Every DLT pipeline has a unique ID, which you use to query its specific event log.
Basic Query:
You can start by exploring the raw events for your pipeline.
-- Replace '<pipeline-id>' with the ID from your DLT pipeline's settings.
SELECT * FROM event_log('<pipeline-id>')
Advanced Data Quality Query:
To create a summary of data quality metrics over time, you can use a more structured query. This is extremely useful for building monitoring dashboards.
Databricks: hands-on tutorial for DLT Data Quality & Expectations
The 'DataOps School' article provides an excellent, ready-to-use SQL query to summarize data quality failures from the event log.
Read the section 'How to Monitor DLT pipelines (Observability)'. Focus on the SQL queries provided, especially the one under '3) Data Quality (DQ) metrics over time'. This is a powerful pattern for production monitoring.
The video below also provides a great walkthrough of querying the event log.
30 DLT Data Quality & Expectations | Monitor DLT pipeline using SQL | Define DQ rule |Observability
This final clip shows how to use the pipeline ID to query the event log directly from a notebook and build summary views for monitoring.
Watch from 14:32 to 17:27. This demonstrates the practical steps of finding your pipeline ID, querying the event log, and interpreting the results to track data quality.
Conclusion
In this lesson, you've learned how to turn a standard DLT pipeline into a robust, quality-enforced workflow. By adding expectations, you embed your business rules directly into the pipeline, ensuring that data is validated as it's processed.
Key Takeaways
- Expectations are declarative rules that consist of a constraint and an action.
- The three actions for handling violations are Warn (allow), Drop (filter), and Fail (stop).
- In Python, you apply expectations using decorators like
@dlt.expect_all,@dlt.expect_all_or_drop, and@dlt.expect_all_or_fail. - Defining rules in a central Python dictionary promotes reusability and clean code.
- Data quality can be monitored in real-time through the DLT UI and historically by querying the event log with SQL.
For more hands-on practice, you can explore end-to-end projects like the one in this GitHub repository (LINK), which heavily features the application of data quality expectations within a medallion architecture.
Next Steps
You now know how to define what your pipeline does (transformations) and the quality it must uphold (expectations). But when should your pipeline run? In the next lesson, we will explore execution modes, and you will learn to differentiate between triggered and continuous pipeline execution modes to match your pipeline's schedule to your business needs.