Hello! Welcome to the third lesson in our module on Delta Live Tables.
In our last lesson, you learned about the medallion architecture, a design pattern for organizing data into Bronze, Silver, and Gold layers to progressively improve its quality and business value. We discussed the what and why behind this structure.
Today, we transition from theory to practice. You will learn how to build a data pipeline that implements the medallion architecture using SQL. By the end of this lesson, you will be able to implement a DLT pipeline using SQL syntax (CREATE LIVE TABLE). This is a core, hands-on skill required for the Data Engineer Associate certification and a fundamental building block for creating production-grade ETL processes in Databricks.
The Declarative Approach in DLT
Before we dive into the code, it's important to grasp a key concept of DLT: it's a declarative framework. Instead of writing step-by-step instructions to create, update, and manage tables (an imperative approach), you simply declare the desired end state of your tables in a SQL notebook.
You'll define each table (Bronze, Silver, Gold) with a SELECT statement. DLT then takes care of the rest:
- It automatically understands the dependencies between tables.
- It builds a visual data flow graph (a Directed Acyclic Graph, or DAG).
- It manages the underlying compute infrastructure.
- It handles orchestration, retries, and error reporting.
This allows you to focus solely on the data transformation logic. Let's see how this is done with SQL.
The Core Syntax: CREATE LIVE TABLE
The fundamental building block of a SQL-based DLT pipeline is the CREATE LIVE TABLE statement. You will write these statements in a Databricks notebook. However, a key point to remember is that you don't run these cells interactively. The notebook serves as the source code for a pipeline that you will configure and run separately through the DLT UI.
There are two main types of live tables you will create:
- Live Tables (
CREATE LIVE TABLE): These tables represent a complete snapshot of the data based on the query at the time the pipeline runs. They are re-calculated in their entirety during each pipeline update. This is suitable for static dimension tables or the final, aggregated Gold tables. - Streaming Live Tables (
CREATE STREAMING LIVE TABLE): These tables are designed for incremental data processing. They process new data as it arrives from append-only sources. This is ideal for ingesting raw data into the Bronze layer and for transformations in the Silver layer that should only process new records.
To see this syntax in action, let's start with a comprehensive video that walks through creating and running a full DLT pipeline using SQL.
Databricks : Delta Live Tables (DLT) | Azure Databricks DLT
This video from The Data Master provides an excellent, practical walkthrough of building a DLT pipeline from scratch. It covers the SQL syntax, UI configuration, and monitoring the results.
Watch the segment from 14:56 to 21:52. Focus on understanding the following key SQL elements: The CREATE STREAMING LIVE TABLE syntax. Using cloudFiles to read from a source (this is Databricks Auto Loader). How to reference another table within the pipeline using the LIVE keyword (e.g., live.sales_order_raw). The use of CONSTRAINT to enforce data quality.
Building a Medallion Pipeline with SQL
Now, let's break down how to implement each layer of the medallion architecture using the syntax you just saw. We will use a practical example of processing retail sales data. The goal is to ingest raw sales and product data (Bronze), join and clean it (Silver), and finally create an aggregated table of top-selling products (Gold).
The following resource provides a complete SQL notebook for this task. We will walk through it layer by layer.
Create declarative ETL pipelines in Databricks with Delta ...
This article from DSStream provides a clear, end-to-end example of a DLT pipeline using SQL to implement the medallion architecture. We will use its code snippets as our guide.
Read the sections 'DLT pipelines example', 'Steps for pipeline creation', and the code snippets for the Bronze, Silver, and Gold layers. You don't need to run this code now; focus on understanding the structure.
1. Bronze Layer: Ingesting Raw Data
The first step is to ingest raw data into Bronze tables. Since data often arrives incrementally (e.g., new files land in cloud storage), we use CREATE OR REFRESH STREAMING TABLE.
Here's how you define a Bronze table to read JSON sales order files using Auto Loader (read_files is an alias for cloud_files):
CREATE OR REFRESH STREAMING TABLE sales_orders
COMMENT "List of sales, ingested from /databricks-datasets."
TBLPROPERTIES ("dataLayer" = "bronze")
AS
SELECT * FROM read_files("/databricks-datasets/retail-org/sales_orders/", "json", map("cloudFiles.inferColumnTypes", "true"));
CREATE OR REFRESH STREAMING TABLE: Declares an incremental table.COMMENTandTBLPROPERTIES: Add metadata for documentation and governance.read_files(...): The function that powers Auto Loader, incrementally ingesting files from the specified path.
2. Silver Layer: Cleaning and Enriching Data
Next, we create Silver tables to clean the data and enrich it by joining our Bronze tables. Notice how we reference the upstream Bronze tables using the LIVE keyword. This is how DLT builds the dependency graph.
We also introduce data quality constraints using CONSTRAINT.
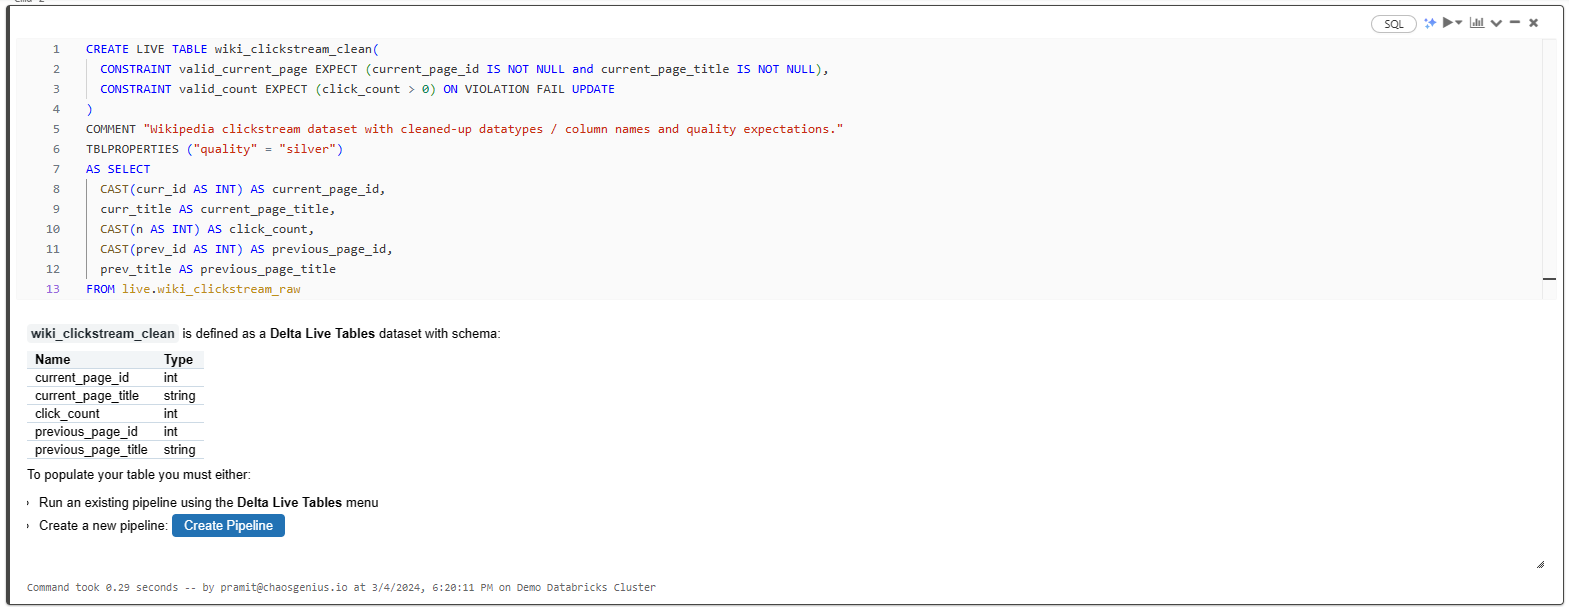
In the example from the article, a Silver table is created to join sales orders with product information. A constraint is added to ensure that every product ID in the sales data exists in the products table.
CREATE OR REFRESH STREAMING TABLE product_sales_categorised(
  CONSTRAINT valid_products EXPECT (mapping_product_id IS NOT NULL) ON VIOLATION FAIL UPDATE
)
COMMENT "Product sales with product category"
TBLPROPERTIES ("dataLayer" = "silver")
AS
SELECT ...
FROM STREAM(LIVE.sales_orders) s
LEFT JOIN LIVE.products p ON s.product_details.id = p.product_id
FROM STREAM(LIVE.sales_orders): This syntax reads the upstreamsales_orderstable as a stream.CONSTRAINT valid_products EXPECT (...): Defines a data quality rule.ON VIOLATION FAIL UPDATE: Tells DLT to stop the pipeline if the expectation is not met. Other options includeDROP ROWor simply logging the violation.
3. Gold Layer: Aggregating for Business Insights
Finally, we create a Gold table for analytics. This table provides an aggregated view, such as total sales by product category. Since this is a final aggregation and not a stream, we can use CREATE OR REFRESH MATERIALIZED VIEW or CREATE LIVE TABLE. A materialized view is a live table where the results are pre-computed, which improves query performance for dashboards.
CREATE OR REFRESH MATERIALIZED VIEW top_products
COMMENT "List of top selling products in USD"
TBLPROPERTIES ("dataLayer" = "gold")
AS
SELECT
  product_category,
  format_number(SUM(product_sales), 'USD ,###') AS total_sales
FROM (
  SELECT product_category, product_price * quantity AS product_sales
  FROM LIVE.product_sales_categorised
  WHERE currency = 'USD'
)
GROUP BY product_category
ORDER BY SUM(product_sales) DESC;
CREATE OR REFRESH MATERIALIZED VIEW: Defines a pre-computed table, perfect for BI.FROM LIVE.product_sales_categorised: It reads from the upstream Silver table.- The logic involves standard SQL
GROUP BYandSUMto create the business-level aggregation.
The image below shows another example of a full Bronze-to-Silver SQL DLT notebook.

Configuring and Running the Pipeline
After defining your tables in a SQL notebook, you need to configure and run the pipeline from the Databricks UI.
Let's return to the first video to see how this is done.
Databricks : Delta Live Tables (DLT) | Azure Databricks DLT
This segment of The Data Master video demonstrates the UI workflow for creating, configuring, and running your DLT pipeline.
Watch the segment from 02:50 to 12:45. Pay close attention to these configuration steps: Naming the pipeline. Selecting the notebook that contains your SQL code. Setting a Target Schema, which is the database where your tables will be published. Choosing a Pipeline Mode: Triggered (runs once) vs. Continuous (runs 24/7). Starting the pipeline and observing how the data flow graph is automatically generated.
Conclusion
In this lesson, you have learned the practical steps to implement a DLT pipeline using SQL. You now know how to translate the conceptual medallion architecture into concrete, declarative SQL statements that Databricks can execute as a robust, automated data pipeline.
Key Takeaways
- DLT pipelines are defined in SQL notebooks using declarative statements like
CREATE LIVE TABLEandCREATE STREAMING LIVE TABLE. STREAMINGtables are used for incremental processing of append-only data, ideal for Bronze and Silver layers.- Dependencies between tables are declared using the
LIVEkeyword (e.g.,FROM LIVE.my_bronze_table). DLT automatically resolves the execution order. - Data quality can be enforced directly within your table definitions using
CONSTRAINT ... EXPECTclauses. - A pipeline is configured and executed via the DLT UI, where you link your notebook and specify settings like the target database and execution mode.
Next Steps
You've now mastered the SQL approach to building DLT pipelines. However, SQL is not the only way. For more complex transformations or to integrate custom logic, you can also use Python. In our next lesson, you will implement a DLT pipeline using Python decorators (@dlt.table), giving you another powerful tool for building data pipelines in Databricks.