Hello! Welcome to the next lesson in our module on orchestrating production workflows.
In our previous lessons, you've learned to build and trigger workflows, both on a fixed schedule and in response to file arrivals. Now that your pipelines are set up to run, the crucial next step is to understand what happens during and after they run. Is the job succeeding? Is it running efficiently? If it fails, why?
This lesson focuses on the operational heart of data engineering: monitoring. We'll explore how to use the Databricks UI to keep a close eye on your jobs. Our goal is to equip you to monitor job runs and view task logs and outputs in the Workflows UI. Mastering this will enable you to ensure your data pipelines are reliable, and to quickly diagnose and resolve any issues that arise.
1. The Landscape of Job Monitoring
In Databricks, monitoring happens at two levels: the individual job level and the workspace level.
- Individual Job View: When you are concerned about a specific pipeline, you'll go to its dedicated page and use the Runs tab. This gives you a detailed history for that job alone.
- Workspace-wide View: To get a bird's-eye view of all pipeline activity across your workspace, you'll use the main Job runs tab in the sidebar.
Let's start by digging into the most common view: monitoring a single job. The official Databricks documentation provides an excellent overview of this interface.
Monitoring and observability for Lakeflow Jobs
This documentation provides a comprehensive guide to the monitoring interface for a single job. Pay close attention to the different views available and the information they provide.
Please read the sections titled 'View runs for a single job' and 'View job run details'. As you read, focus on: The difference between the matrix view (visual history) and the list view (tabular data). How color-coding (green for success, red for failure) helps you quickly assess status. The concept of drilling down from the runs list into a specific job run details page to find outputs and logs.
As you've just read, the Runs tab is your primary tool for monitoring a specific job. You can quickly see the status of recent runs in the matrix or list view. The most important action here is selecting a specific run to investigate further, which takes you to the job run details page. This page is an immutable snapshot of everything that happened during that execution.
2. Inspecting a Successful Run
Let's see this in action. The best way to understand the monitoring UI is to watch a job as it executes and then inspect the results of a successful run.
Automating Databricks Workflows - A Game Changer for Data Engineering
This video from The Data Master will walk you through the process of running a job and observing its lifecycle from 'pending' to 'succeeded'. It clearly shows how to access the final output.
Watch the segment from 27:13 to 31:10. Notice how the status changes and how the presenter clicks on the completed run to view the notebook output directly within the Workflows UI.
The video demonstrates a key concept: a job run's output is a rendered, read-only version of the notebook. This is incredibly useful for verifying that the code did what you expected and for sharing results with others without giving them access to the code itself.
Hands-On: Review Your Last Successful Run
Now, it's your turn to practice.
- Navigate to the Workflows UI in your Databricks workspace and select the
My Practice Workflowjob you configured in the previous lesson. - Go to the Runs tab. You should see at least one successful run from when you tested the file arrival trigger. It will be marked with a green check.
- Click on the Start time of that successful run to open the Job run details page.
- You'll see a visual representation of the task(s). Click on the task box.
- In the panel on the right, you'll see the details for that task, including a snapshot of the notebook. Scroll through this view to see the code and the output of each cell. This is the "output" of your job run.
If you need to share these results, you can use the Export to HTML feature mentioned in the Monitoring and observability documentation (section "Export job run results") to download a standalone version of the output notebook.
3. Diagnosing a Failed Run
Monitoring is most critical when things go wrong. The Workflows UI is designed to help you quickly pinpoint the source of an error. When a task fails, the graph view immediately flags the problematic step in red.
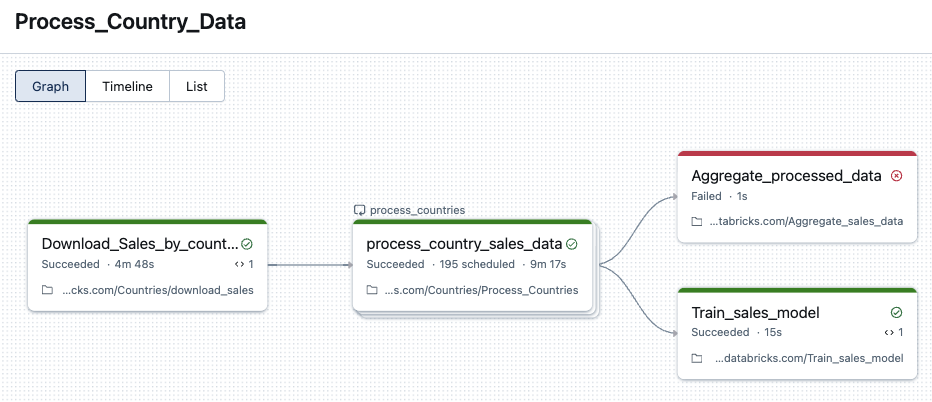
Once you've identified the failed task, you can drill down to find the root cause. Let's see how.
Tutorial - Schedule a Job and Automate a Workload | Databricks Academy
This official tutorial from Databricks Academy provides a perfect demonstration of troubleshooting a failed job.
Watch from 02:26 to 02:57. The presenter clicks 'view details' on a failed run and scrolls through the notebook snapshot to find the exact cell and error message that caused the failure.
The process is systematic: find the red light, click on it, and read the error message. The error is presented in the context of the code, making it much easier to debug than if you were just looking at raw log files.
Let's reinforce this with a clear, written example.
Basics of Databricks Workflows - Part 2: Monitoring your pipeline
This Databricks community blog post provides another concise example of identifying a failure and its root cause.
Read the short section titled 'Identifying job failures'. It shows how hovering over or clicking the failed task reveals the specific error message, in this case, a Python NameError.
Hands-On: Create and Diagnose a Failure
Theory is good, but practice is better. Let's intentionally break your workflow to practice your new diagnostic skills.
-
Introduce an Error:
- Navigate to the notebook that is run by your
My Practice Workflowjob. - Add a new cell at the end of the notebook with a command that is guaranteed to fail.
- If your notebook is SQL-based, add:
SELECT * FROM non_existent_table; - If it's a Python notebook, add:
print(undefined_variable) - Save the changes to your notebook.
- Navigate to the notebook that is run by your
-
Run the Job:
- Go back to your
My Practice Workflowjob in the Workflows UI. - Click the Run now button in the top right to trigger a manual run.
- Go back to your
-
Diagnose the Failure:
- Go to the Runs tab. Wait for the job run to finish. It should end with a Failed status and a red 'X'.
- Click on the Start time of this failed run.
- On the job run details page, click on the red task box.
- In the panel that appears, scroll down through the notebook snapshot. Find the cell you added and inspect the error message displayed beneath it.
You have now successfully simulated a real-world failure and used the Databricks UI to perform a root cause analysis. Remember to remove the faulty code from your notebook!
4. Workspace-Level Monitoring: The Big Picture
Finally, sometimes you need to zoom out from a single job and see the health of all data pipelines in your workspace. This is the purpose of the main Job runs tab.
Monitoring and observability for Lakeflow Jobs
Let's return to the official documentation to understand the features available for workspace-wide monitoring.
Read the section 'View recent job runs across all jobs'. Focus on the purpose of these three components: Finished runs count graph: For identifying trends in failures or successes. Top 5 error types table: For spotting recurring, systemic problems. Job runs list: For filtering and finding specific runs across all jobs.
This global view is invaluable for data engineering leads or anyone responsible for the overall stability of the data platform. It helps you move from fixing a single fire to understanding if there's a systemic issue you need to address.
Conclusion
In this lesson, you've learned the essential skills for monitoring your Databricks Workflows. You now know how to track the status of your jobs, inspect the outputs of successful runs, and, most importantly, how to efficiently diagnose the root cause of a failure.
Key Takeaways
- Job monitoring is conducted through the Runs tab for individual jobs and the main Job runs tab for a workspace overview.
- The UI uses intuitive color-coding (green for success, red for failure) to provide at-a-glance status information.
- Each job run creates an immutable snapshot of the notebook, including code and cell outputs, which serves as the primary log and result artifact.
- To diagnose a failure, you drill down from the failed run to the specific failed task and inspect its notebook snapshot to find the error message.
Next Steps
Now that you can identify why a job failed, the logical next question is: "What should the system do about it?" In our next lesson, we will address this by exploring how to build more resilient pipelines. You will learn how to configure task failure handling including retry policies and expected duration, which allows your jobs to automatically recover from transient issues.