Introduction
Welcome to the first lesson of our fourth module. In the previous module, we developed a sophisticated measurement plan, culminating in a method for constructing a composite Triadic_Satisfaction index and protocols to ensure high-fidelity data collection. While robust measurement is a cornerstone of good science, it is only half the battle. The statistical analyses we perform on that data must be equally rigorous. Without a predefined and principled analysis plan, even the cleanest data can lead to misleading conclusions.
This lesson directly addresses this challenge by introducing the concept of the "replication crisis" in science and one of its primary drivers: researcher degrees of freedom (RDFs). Our learning outcome is to identify and catalogue the researcher degrees of freedom specific to the analysis of our complex vee experiment. We will define what RDFs are, explore why they are so problematic, and then systematically walk through our proposed experiment to map out the "garden of forking paths"—the multitude of analytical choices that could, if made flexibly, compromise the integrity of our findings. This catalogue will serve as the foundation for our next lesson, where we will construct a pre-registration plan to constrain these choices.
1. The Peril of Flexibility: Researcher Degrees of Freedom
In the course of designing a study, collecting data, and analyzing it, researchers must make countless decisions. Many of these decisions may seem minor or arbitrary, but their cumulative effect can be profound. The collection of these choices is what we call researcher degrees of freedom.
When these choices are made after seeing the data, often with the goal of finding a statistically significant result, they can dramatically inflate the rate of false positives. This practice, sometimes called p-hacking or questionable research practice (QRP), is a major contributor to the well-documented replication crisis in psychology, medicine, and other fields.
[PDF] False-Positive Psychology: Undisclosed Flexibility in Data Collection ...
This seminal paper by Simmons, Nelson, and Simonsohn clearly defines researcher degrees of freedom and demonstrates their powerful effect on false-positive rates. It's an essential read for understanding the modern landscape of statistical practice.
As you read, please focus on these key parts: First, read the introduction from the beginning to the discussion of outliers. This section introduces the core problem and defines researcher degrees offreedom. Next, review the two "experiments" described under the heading "A Demonstration of Chronological Rejuvenation". These are powerful, if fabricated, examples of how RDFs can be used to "prove" something false. Finally, carefully examine Table 1 and the accompanying text in the section "Simulations of common researcher degrees of freedom". This table quantifies how four common RDFs, alone and in combination, can increase the false-positive rate from the nominal 5% to over 60%.
The key insight from Simmons et al. is that these exploratory behaviors are not necessarily malicious. They often arise from ambiguity combined with a natural desire to find a meaningful result. As a statistician, you are well aware that there is often no single "correct" way to analyze a dataset. The problem is not the existence of choices, but making those choices in a data-dependent way and only reporting the analysis that "worked."
Professor Andrew Gelman refers to the multiplicity of these analytical pathways as the "garden of forking paths." A given dataset can be analyzed in thousands of different, and equally plausible, ways. If a researcher tries enough of these paths, they are almost guaranteed to find a statistically significant result by chance alone.
The Statistical Crisis in Science and How to Move Forward by Professor Andrew Gelman
In this talk, Andrew Gelman discusses the statistical crisis in science, providing a high-level critique that will resonate with your statistical background. He highlights how noisy data, combined with a search for significance, leads to absurd and non-replicable findings.
Please watch the following segments: This section gives examples of startling and now-discredited findings from political science, such as the link between ovulation and voting. These illustrate the real-world consequences of exploiting RDFs. Here, Gelman explains the "statistical significance filter," a critical concept where the requirement for publication (p < .05) leads to a systematic overestimation of effect sizes and creates a feedback loop of poorly designed studies.
2. A Systematic Checklist for Identifying RDFs
To protect our own experiment from these pitfalls, we must first become acutely aware of every possible choice we could make. A comprehensive framework is invaluable for this task.
Degrees of Freedom in Planning, Running, Analyzing, and ...
This paper by Wicherts et al. provides a detailed checklist of 34 common researcher degrees of freedom, categorized by the phase of the research process. It serves as an excellent tool for auditing a research plan.
Please start by reading the introductory sections that define RDFs and the role of preregistration. Pay close attention to the criteria for an ideal preregistration: it must be specific, precise, and exhaustive. Next, carefully review Table 1, which provides the full checklist of 34 RDFs. We will use this table as a structured guide for the rest of the lesson.
This checklist provides a powerful lens through which to view our own proposed experiment on the vee triad. Our goal is not just to be aware of these RDFs in the abstract, but to catalogue precisely how they could manifest in our specific design.
3. Cataloguing the RDFs in the Vee Relationship Experiment
Let's now apply the Wicherts et al. checklist to our N-of-1 crossover experiment. For each potential RDF, we will formulate it as a specific decision we need to make about our study.
Design & Data Collection Phase DFs
Many crucial RDFs are embedded in the design and data collection protocol.
- (D3/D4/A5/A7) Choice of Primary Outcome: Our primary outcome is the
Triadic_Satisfactionindex.- Forking Path 1: What if the composite index shows no effect, but an individual sub-scale (e.g., the Pivot's individual satisfaction) does? We might be tempted to switch our primary outcome. This is outcome switching (D4, A7).
- Forking Path 2: We are also measuring secondary constructs like "perceived relationship stability." We might be tempted to elevate this to a primary outcome if the satisfaction measures fail to show an effect.
- (D2/A10) Use of Covariates: We are collecting extensive background data (e.g., relationship duration, age, personality traits of all three members, baseline stress levels).
- Forking Path: The effect of the living arrangement might only become "significant" after controlling for Partner A's baseline anxiety and the triad's overall financial stress. Deciding which of dozens of potential covariates to include after seeing the data is a major RDF.
- (D5/A12) Participant/Data Exclusion Criteria: We are collecting daily EMA data.
- Forking Path: What defines a compliant participant? Do we exclude data from days where fewer than 50% of prompts were answered? Or 70%? Do we exclude participants who consistently respond too quickly? Defining these rules post-hoc allows a researcher to massage the dataset until a desired result appears.
- (C4/D7) Data Collection Stopping Rule: Our experiment uses a crossover design with fixed-length periods. However, a researcher might be tempted to analyze the data as it comes in.
- Forking Path: A researcher might test for significance at the end of each week. If the p-value is < .05, they might stop the experimental period early. If it's > .05, they might continue collecting data. This practice, known as optional stopping, dramatically inflates the false-positive rate.

p-hacking: What it is and how to avoid it!
This StatQuest video provides a clear, animated explanation of why optional stopping is a form of p-hacking.
Watch the segment from this timestamp. It visually demonstrates how sequentially adding data points in search of a significant p-value can easily lead to a false positive.
Analysis Phase DFs
The analysis phase is a minefield of RDFs, especially for a complex design like ours.
- (A1) Missing Data Handling: We will inevitably have missed EMA prompts.
- Forking Path: How do we handle this? We could use listwise deletion (dropping the day), pairwise deletion, mean-imputation for the day, or a more complex method like Full Information Maximum Likelihood (FIML) or Multiple Imputation. Each choice can yield a different result.
- (A4) Outlier Handling:
- Forking Path: How do we define an outlier on our satisfaction scales? Any response > 2 standard deviations from the person's mean? Or > 3? Do we delete the data point or use winsorization to pull it towards the mean?
- (A6) Scoring the Dependent Variable:
- Forking Path: We plan to use a second-order CFA to create our
Triadic_Satisfactionindex. But even here there are choices. Will we use regression-based factor scores or Bartlett scores? Or might we abandon the CFA and just use a simple unweighted average of all items if that gives a "better" result?
- Forking Path: We plan to use a second-order CFA to create our
- (A9) Operationalizing the Independent Variable:
- Forking Path: Our primary IV is
Living_Arrangement. Our crossover design might have periods likeNesting,Partner_A_Separate,Partner_B_Separate. A researcher could testNesting vs. A_Separate,Nesting vs. B_Separate,A_Separate vs. B_Separate, orNesting vs. (average of A and B separate). Without a pre-specified contrast, this allows for multiple comparisons.
- Forking Path: Our primary IV is
- (A13) Choice of Statistical Model: This is arguably the largest "garden" for our study. The data is multilevel (time points nested in participants, who are nested in triads) and has dependencies (interference).
- Forking Path 1 (Model Type): We could use a linear mixed-effects model (LMM), a Generalized Estimating Equations (GEE) model, or even improperly aggregate the data and run a simpler repeated-measures ANOVA.
- Forking Path 2 (LMM Specification): If we choose an LMM, what is the random effects structure? Random intercepts for each participant? For each triad? Random slopes for the effect of time? The number of potential model specifications is enormous.
- (A15) Choice of Inference Criteria:
- Forking Path 1 (Multiple Comparisons): We are measuring satisfaction for three individuals and several dyads. If we test the effect of the living arrangement on each outcome separately, are we correcting for multiple comparisons? We could use a strict Bonferroni correction, a more lenient False Discovery Rate (FDR) correction, or no correction at all.
- Forking Path 2 (One-sided vs. Two-sided tests): If our hypothesis is that nesting improves satisfaction, we might be tempted to use a one-tailed test. This makes it easier to achieve significance but assumes an effect in the opposite direction is impossible.
This entire network of decisions can be visualized as a flowchart, where each node represents a choice point.
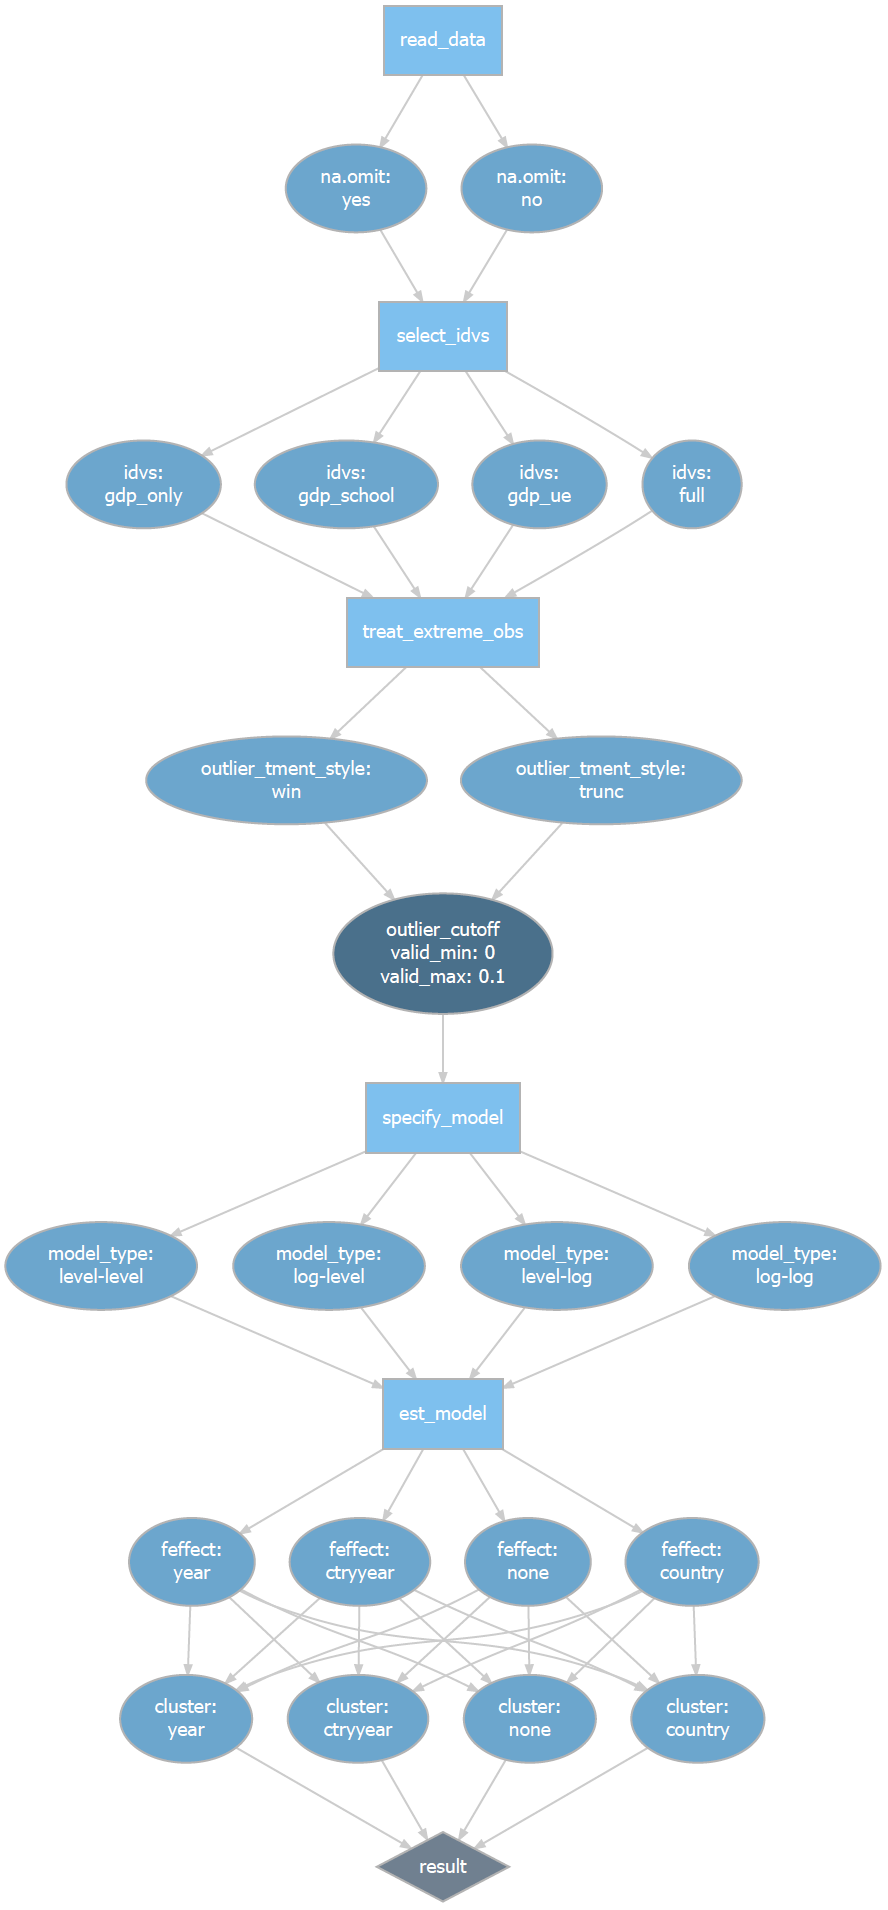
Our specific vee experiment has a similar, but even more complex, set of forking paths due to the triadic structure, interference, and longitudinal measurements.
Conclusion
In this lesson, we have taken a critical look at the research process, moving from the "how-to" of measurement to the "how-not-to" of analysis. By understanding the pervasive nature of researcher degrees of freedom, we can begin to guard our own work against the biases they introduce.
Key Takeaways:
- Researcher Degrees of Freedom (RDFs) are the many decisions a researcher makes during data collection and analysis.
- When these decisions are made flexibly and in a data-dependent manner, they constitute p-hacking, which dramatically increases the risk of false positives and leads to non-replicable findings.
- These choices exist at every stage of research: defining outcomes and covariates (Design), setting stopping and exclusion rules (Collection), and specifying the statistical model (Analysis).
- For our complex vee experiment, key RDFs include how we handle missing data, which covariates to include, the specific structure of our statistical model, and how we correct for multiple comparisons across the three partners.
The point of this exercise is not to be pessimistic or to suggest that research is impossible. The solution is transparency and planning. Having catalogued these potential pitfalls, we are now in a position to proactively address them.
In our next lesson, we will take this catalogue and use it to build our primary defense against p-hacking: a pre-registration plan. We will learn how to formulate a document that specifies our primary outcomes, analysis models, and rules for handling contingencies before we analyze the data, thereby constraining our own degrees of freedom and ensuring the credibility of our results.