Introduction
In our recent lessons, we've been methodically assembling the components of a comprehensive structural causal model for your triadic relationship study. We've defined the system's structure, accounted for interference, and even encoded the flow of time to capture dynamic effects like adaptation and carryover. Now, we will confront a notorious pitfall in data analysis that underscores the critical importance of a sound causal model: Simpson's paradox.
This lesson focuses on a specific type of modeling error: the trap of aggregation. You will learn how combining data from different subgroups can create spurious trends, sometimes even reversing the true effect of a variable. By the end of our session, you will be able to demonstrate how Simpson's paradox could manifest when analyzing satisfaction data across the different roles (Pivot, Partner B, Partner C) or dyads in your vee-triad experiment, fulfilling a key objective in our module on structural modeling.
1. The Paradox of Aggregation
At its core, Simpson's paradox is a statistical illusion. It occurs when a trend that appears in different groups of data disappears or reverses when these groups are combined. What might look like a positive association in the total population could, in fact, be a negative association within every single subgroup.
To build an initial intuition, let's watch a video from Dr. Trefor Bazett that uses real-world data on COVID-19 fatality rates to illustrate this phenomenon with remarkable clarity.
How SIMPSON'S PARADOX explains weird COVID19 statistics
This video provides a very accessible introduction to Simpson's Paradox using a real-world example and clear visuals.
Watch the first part of the video, from the beginning to the main explanation. Pay close attention to how the relationship between country and survivability flips when the data is disaggregated by age group. The scatter plot visualization starting at this point is an excellent abstract representation of the paradox.
The key takeaway is that an unobserved variable—in this case, the age distribution of patients in each country—can create a misleading trend in the aggregated data. This "lurking" variable is what we, in causal inference, would label a confounder.
The image below shows the classic visual signature of the paradox. When all the data points are pooled together (ignoring the colors), the overall trend line (in blue) slopes downward. However, within each subgroup (distinguished by color), the trend is clearly upward.

2. The Causal Story: Why It Happens
The paradox is resolved by moving from a purely statistical description to a causal explanation. The decision of whether to trust the aggregated or the subgroup-specific results is not a statistical choice—it is a causal one, determined entirely by the underlying causal structure of the problem.
This is where your knowledge of Directed Acyclic Graphs becomes essential. Let's watch another video, this time from Brady Neal's "Causal Inference" course, which uses DAGs to dissect the paradox.
1.2 - Motivating Example: Simpson’s Paradox
This video is crucial because it explains how the correct interpretation of the data in Simpson's paradox depends entirely on the underlying causal DAG.
Please watch the entire video from start to finish. It presents two contrasting scenarios for the same data: Scenario 1: The grouping variable (patient condition) is a confounder that influences both the treatment assignment and the outcome. Scenario 2: The grouping variable is a mediator, where the treatment itself affects the patient's condition, which in turn affects the outcome. Notice how changing a single arrow in the DAG completely reverses the conclusion about which treatment is better. This demonstrates that you cannot resolve the paradox without making an explicit assumption about the causal story.
As the video makes clear, Simpson's paradox often arises from a classic confounding structure. Consider the case where the grouping variable, let's call it , is a common cause of both the treatment and the outcome .
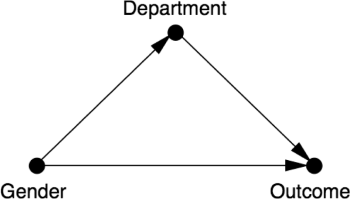
In this structure, and . When you analyze the relationship between and by aggregating all data, you are ignoring . This leaves the "backdoor path" open, and the observed association between and becomes a mix of the true causal effect and spurious correlation from the confounder . By analyzing the data within each level of , you are effectively "blocking" this backdoor path, isolating the true effect of on .
This distinction is not merely academic; it is the fundamental challenge of causal analysis in non-experimental data. The following commentary provides a sharp perspective on this, arguing that these paradoxes are not statistical curiosities but direct consequences of trying to infer causation without causal reasoning.
The role of causal reasoning in understanding Simpson's paradox ...
This paper argues forcefully that Simpson's paradox is fundamentally a problem of causal inference, not statistics. It emphasizes that the choice between an aggregated or disaggregated analysis must be based on the assumed causal structure (the DAG).
Please read the following sections: The Abstract, which frames the problem. The section starting with "At the heart of the phenomenon". This part explicitly links the paradox to covariate selection for confounding and introduces the use of DAGs. The section beginning "As Pearl has noted". This is a key section that uses the do()-operator to distinguish between observational probabilities, P(Y|X), and interventional (causal) probabilities, P(Y|do(X)), which is the crux of the issue.
The paper's central message is that statistics alone cannot tell you whether to adjust for a third variable. Only your background knowledge, encoded in a DAG, can guide that decision.
3. Simpson's Paradox in the Vee-Triad Experiment
Now, let's apply this to your study. How could you be misled by Simpson's paradox when analyzing the satisfaction data from the vee-triad?
Imagine you are testing the effect of a specific intervention, let's say a new communication protocol (T), on individual satisfaction (Y). You collect satisfaction data from all three members of the triad: the Pivot (A), Partner B, and Partner C.
It's tempting to pool all the data together to increase your statistical power and get one overall estimate of the protocol's effect. However, the role of the person in the triad (Pivot, Partner B, or Partner C) could be a powerful confounder.
Let's construct a plausible causal story that would produce the paradox:
-
Causal Structure: The person's Role (Z) is a common cause of both their likelihood of adopting the Communication Protocol (T) and their baseline Satisfaction (Y). The DAG is , with a direct arrow representing the true causal effect we want to estimate.
-
Plausible Mechanism:
- : Let's assume the Pivot's role carries more inherent stress and responsibility. Consequently, the Pivot might have a lower baseline level of satisfaction compared to Partners B and C, independent of any specific communication protocol.
- : As the central figure managing two relationships, the Pivot might be more motivated to adopt and rigorously follow the new communication protocol than the other partners. Thus, the Pivot has a higher probability of being in the "treatment" group.
- : Let's assume the protocol is genuinely effective. For any given person, adopting the protocol increases their satisfaction.
-
The Paradoxical Result:
- When you analyze the data within each role, you find that the communication protocol is associated with higher satisfaction for the Pivot, for Partner B, and for Partner C. The effect is positive in all three subgroups.
- However, when you aggregate the data, you are combining a group (Partners) with high baseline satisfaction and low treatment uptake with another group (the Pivot) with low baseline satisfaction and high treatment uptake.
- The resulting aggregated data could show that individuals who used the protocol (who are disproportionately the lower-satisfaction Pivot) have, on average, lower satisfaction than those who did not (who are disproportionately the higher-satisfaction Partners). This would lead to the dangerously incorrect conclusion that the communication protocol is harmful.
To avoid this, your causal model and analysis plan must explicitly account for Role as a confounder. In statistical terms, this means not running a simple pooled regression of Satisfaction ~ Protocol. Instead, you would need a model that includes Role as a covariate, effectively estimating the effect of the protocol conditional on role.
The following resource shows exactly how this is done in a Bayesian modeling context, contrasting a naive pooled model with a more appropriate unpooled or hierarchical model that accounts for the grouping variable.
Simpson's paradox — PyMC example gallery
This tutorial demonstrates the statistical modeling side of Simpson's paradox, contrasting a model that ignores the confounder with one that correctly includes it.
Read through the sections Model 1: Pooled regression and Model 2: Unpooled regression with counfounder included. Focus on the contrast between the causal DAGs and the resulting regression outputs for each model. Model 1's causal assumption is that the group variable doesn't matter, leading to the wrong conclusion. Model 2's causal assumption explicitly includes the group as a confounder, which resolves the paradox and reveals the true, within-group relationship.
This practical example solidifies the link between the causal DAG and the statistical model required to get the right answer. The choice of model is dictated by the arrows in your graph.
Conclusion
This lesson has demonstrated that Simpson's paradox is more than a statistical curiosity; it is a fundamental challenge in causal inference that arises from naive data aggregation. The paradox serves as a powerful reminder that correlation is not causation and that statistical associations can be deeply misleading without a guiding causal model.
Key Takeaways:
- Simpson's Paradox: A trend observed in aggregated data can disappear or reverse when the data is disaggregated into subgroups.
- Causal Explanation: The paradox is typically caused by a confounding variable that is correlated with both the treatment and the outcome. Aggregating the data is equivalent to ignoring the confounder, leading to biased estimates.
- DAGs are Key: The decision to analyze data in aggregate or by subgroup is a causal one. The correct approach is determined by the underlying causal structure, which should be explicitly represented in a DAG.
- Application to Triad: In your experiment, aggregating satisfaction data across different roles (Pivot, Partner B, Partner C) or dyads without proper adjustment could produce a Simpson's paradox, as
Roleis likely a confounder influencing both behavior and satisfaction.
In our next lesson, we will begin the final module on causal identification. Armed with our detailed structural causal model—now fortified against pitfalls like aggregation bias—we will explore how to use the rules of do-calculus to formally determine whether the causal effects you care about can be estimated from the data you plan to collect.