Welcome to the final lesson of our CUDA Programming Essentials module. Throughout this module, we've built your toolkit from the ground up: starting with the fundamentals of host and device code, managing memory, and launching kernels. We then graduated to more advanced, performance-critical topics like asynchronous execution with streams, and sophisticated memory management using pinned and unified memory.
Today, we transition from these foundational CUDA C++ concepts to the real-world application you're here for: optimizing deep learning models. This lesson is the bridge. We will use NVIDIA Nsight Systems, a professional-grade system profiler, to perform a system-wide analysis of our case-study models, GPT-2 small and ResNet-50. Your goal is to establish a clear, quantitative performance baseline for a standard PyTorch forward pass. This baseline is the essential "before" picture against which we will measure all future optimizations. Think of it as establishing the initial lap time before we start tuning the engine.
Profiling: The First Step to Optimization
Before we can make code faster, we must first understand where it's spending its time. A profiler is a tool that observes a program's execution and generates a detailed report, or "trace," that visualizes this information. This allows us to move from guesswork to data-driven optimization.
There are many profilers, but for our purposes, Nsight Systems is the ideal starting point. It provides a holistic, system-wide view of your application's execution, capturing activity across the CPU, GPU, OS, and CUDA driver APIs simultaneously on a unified timeline. This is crucial for understanding the complex interplay between the different components in a deep learning workload.
Navigating NVIDIA Nsight Systems for Efficient Profiling - Henry Ko
This blog post by Henry Ko provides an excellent, practical introduction to Nsight Systems. We'll use it to frame our initial exploration.
To begin, please read the "Why Nsight Systems over other profilers?" section. Focus on the author's four main reasons for choosing this tool: its key benefits. This will clarify why we are starting here rather than with a framework-specific tool like the PyTorch Profiler.
Capturing a Performance Trace
Nsight Systems is primarily a command-line tool, nsys, that you run to launch and monitor your application. The basic syntax is straightforward, but a few flags are essential to ensure we collect all the necessary information.
Navigating NVIDIA Nsight Systems for Efficient Profiling - Henry Ko
Let's continue with the same article to see how to run the profiler.
Read "Part 1: Profiling". The author provides a simple command template. Pay close attention to the recommended flags, particularly the trace options. Understanding what cuda, nvtx, and osrt capture is key to getting a rich, informative trace.
So, to profile a PyTorch script, say forward_pass.py, that runs a few iterations of your model, the command would look like this:
nsys profile --trace=cuda,nvtx,osrt -o my_model_baseline python forward_pass.py
This command executes your script and, upon completion (or interruption with Ctrl+C), generates a my_model_baseline.nsys-rep file. This file contains the complete performance trace, ready to be analyzed in the Nsight Systems GUI.
The Anatomy of an Nsight Systems Trace
Opening an .nsys-rep file for the first time can be intimidating. You're presented with a dense timeline of events. Let's break down the most important rows to focus on initially.
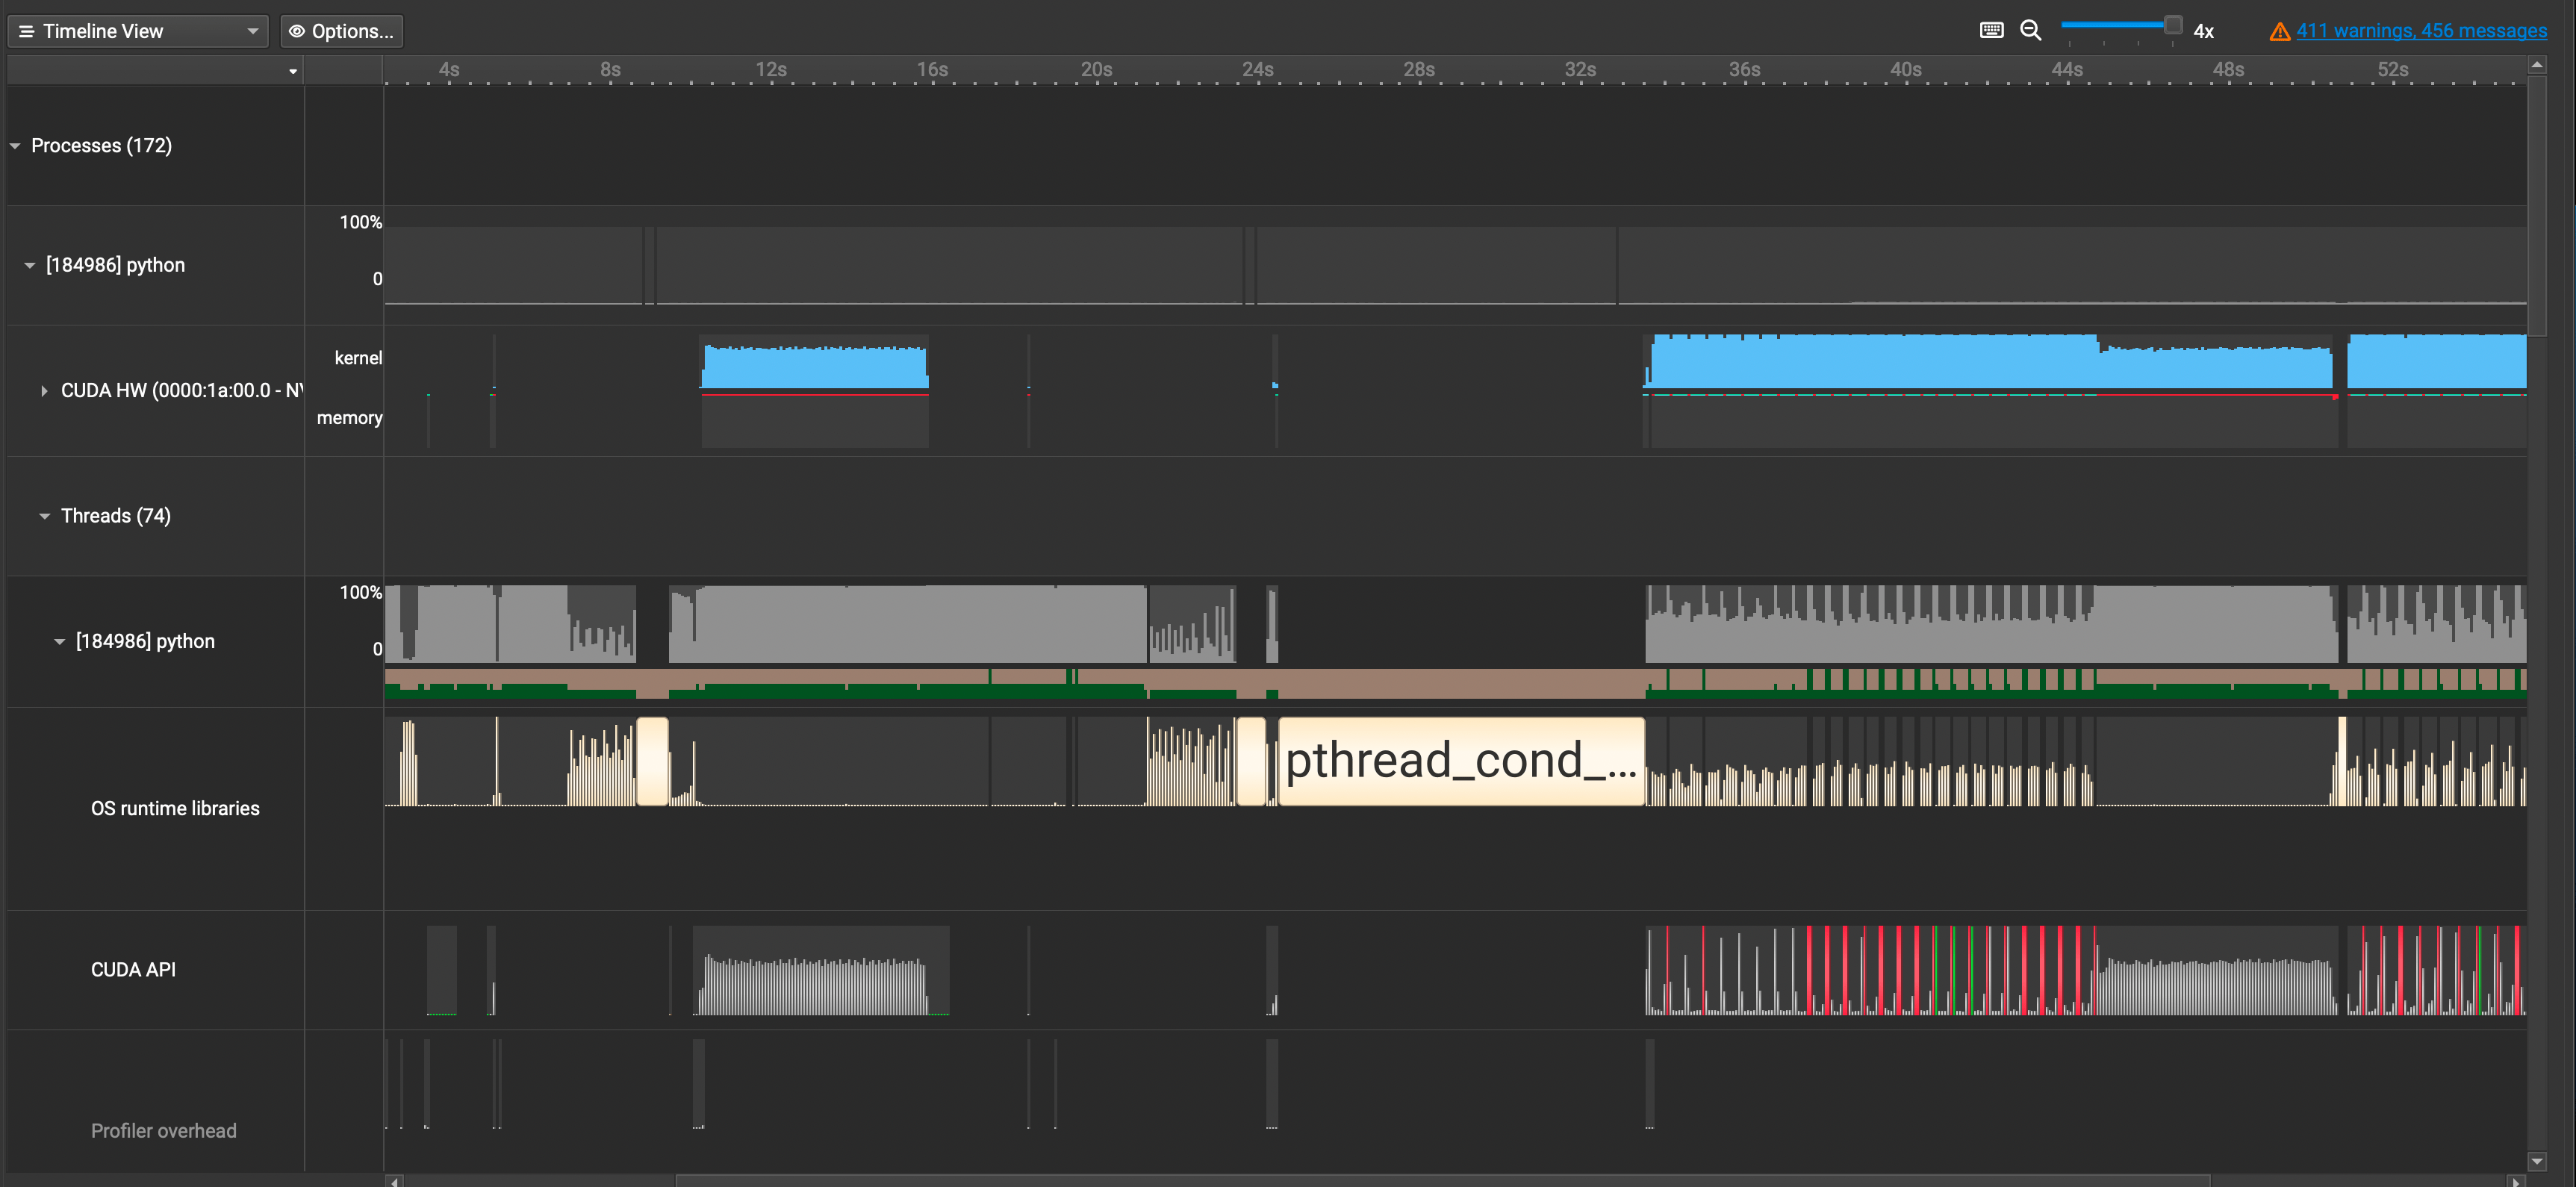
Here are the key "swimlanes" you'll see in the timeline:
- CUDA HW (Hardware): This is the ground truth of what the GPU is doing. The
kernelsub-row shows the execution of CUDA kernels (the blue blocks), while thememoryrow shows data transfers. Large gaps of white space here represent GPU idle time—a primary target for optimization. - Threads: This section shows CPU thread activity. You'll typically see a main
pythonthread that is responsible for executing your script. The gray blocks show when the CPU is active. Gaps here often correspond to the CPU waiting for I/O or, critically, for the GPU. - OS runtime libraries: This provides a deeper view of OS-level activities, including thread synchronization events like
pthread_cond_wait. Seeing your Python thread spend a lot of time here is a strong hint that it's blocked, waiting for something to complete. - CUDA API: This row shows the sequence of calls made from the CPU to the CUDA driver (e.g.,
cudaLaunchKernel,cudaMemcpyAsync). Correlating this with theCUDA HWrow visually demonstrates the asynchronous nature of CUDA. The CPU can issue a long stream of commands, which are queued and executed later by the GPU.
Making Sense of the Chaos: NVTX Annotations
A raw trace is a jumble of kernel names. To make it useful, we must correlate these low-level events with our high-level source code. This is where the NVIDIA Tools Extension (NVTX) comes in. NVTX is a C-based API (with convenient Python bindings) that lets you "annotate" your code, creating custom markers and ranges that appear directly in the profiler timeline.
PyTorch integrates NVTX, so you can use a simple Python context manager to label parts of your code. For example, to label the forward pass and a specific layer within it:
import torch.cuda.nvtx as nvtx


# ... model and data setup ...

for i, data in enumerate(dataloader):


    # Annotate the entire forward pass
    nvtx.range_push(f"Forward Pass Iter {i}")


    # ... move data to GPU ...


    # You can nest annotations
    nvtx.range_push("Layer 1")
    output = model.layer1(data)
    nvtx.range_pop()

    nvtx.range_push("Layer 2")
    output = model.layer2(output)
    nvtx.range_pop()


    # ... and so on ...

    nvtx.range_pop() # Pop the "Forward Pass" range
Now, when you profile this code, these labels will appear as named ranges in a dedicated NVTX row, allowing you to immediately identify which kernels and API calls correspond to "Layer 1" versus "Layer 2".

Analyzing the Baseline: What to Look For
Now that you can generate and navigate an annotated trace, the real work begins: analysis. The goal is to understand the performance characteristics of your vanilla model. Let's walk through a typical analysis workflow, drawing from expert examples.
Mastering Nvidia Nsight GPU Profiling
This presentation from AI Performance Engineering is an excellent masterclass in using Nsight Systems to diagnose and fix real-world performance bottlenecks. We'll use its methodology as our guide.
Please watch the introduction and the first case study on CPU-to-GPU bottlenecks. First, listen to the speaker's introduction of Nsight Systems and how it contrasts with framework-level profilers. Then, watch the detailed analysis of a ResNet-18 training loop, from the initial trace. Pay close attention to how the speaker identifies the problem: he observes significant GPU idle time (white space) and correlates it with a long-running "get_batch" operation on the CPU. This is a classic data input bottleneck.
As the video demonstrates, the first things to look for are the most obvious inefficiencies:
-
GPU Idle Time: Is the
CUDA HWrow mostly blue (busy) or white (idle)? In a well-optimized training loop, the GPU should be the bottleneck, meaning it should be constantly busy processing data. Large white spaces indicate that the GPU is waiting—for data from the CPU, for a synchronization event, etc. -
Startup vs. Steady State: The first one or two iterations of a model are often much slower than subsequent ones. This "warm-up" period involves one-time costs like allocating memory caches, JIT compilation of kernels (
torch.compileis an extreme example of this), and filling data loader pipelines. Your analysis should focus on the performance of the "steady state" iterations, as these are representative of the bulk of the training run. -
Implicit Host-Device Synchronization: This is a more subtle but critical performance killer. Asynchronous execution is key to performance, as it allows the CPU to work ahead of the GPU, ensuring the GPU never starves for work. However, certain operations can inadvertently force the CPU to stop and wait for the GPU to finish all its pending work. This is called a host-device synchronization.
Lecture 16: On Hands Profiling
Let's watch another expert, Taylor, from the "GPU MODE" channel, as he debugs this exact issue. This is a fantastic demonstration of finding a "needle in a haystack" performance bug.
Watch the section from this timestamp. The key moment is when he spots a cudaStreamSynchronize call in the profiler. He correctly identifies that this should almost never happen in well-written code. He then traces it back to two common Python pitfalls: Using a Python function like max() on a tensor, which forces the value to be read back to the CPU. Creating a tensor from a Python list inside a loop (torch.tensor([a, b, c])), which forces a host-to-device copy and synchronization on each iteration. Fixing these eliminates the synchronization and unlocks significant performance gains by keeping the execution asynchronous.
Your Turn: Establish the Baseline
Now it's time to apply these concepts. Your task is to create baseline profiles for a single forward pass of both GPT-2 small and ResNet-50.
-
Prepare a Script: For each model, create a simple Python script that does the following:
- Initializes the model and moves it to the GPU (
.to('cuda')). - Creates some random input data of the correct shape and moves it to the GPU.
- Loops for about 5-10 iterations.
- Inside the loop, run a single forward pass:
model(inputs). - Crucially, add NVTX ranges to annotate at least the entire forward pass within the loop. For extra credit, you can try adding finer-grained annotations for key blocks (e.g., individual Transformer blocks in GPT-2 or Residual blocks in ResNet-50).
- Initializes the model and moves it to the GPU (
-
Profile: Use the
nsys profilecommand to capture a trace for each script, running for all iterations. -
Analyze: Open the resulting
.nsys-repfiles in the Nsight Systems GUI and answer the following questions for each model:- Ignoring the first 1-2 warm-up iterations, what is the average duration of a single forward pass in the steady state? Use the NVTX range to measure this precisely.
- Look at the
CUDA HWtimeline during a steady-state iteration. Qualitatively, what is the GPU utilization like? Do you see solid blocks of kernels, or are there significant gaps? - Zoom in on a single forward pass. Can you identify patterns in the kernels being launched? For ResNet, you should see many convolution kernels (often from the cuDNN library). For GPT-2, you'll see large matrix multiplications (GEMMs) for the linear layers and other kernels for the attention mechanism.
- Scan your trace for any unexpected
cudaDeviceSynchronizeorcudaStreamSynchronizecalls within the main loop.
Keep these trace files and your notes. They are the starting point for our entire optimization journey.
Conclusion
In this lesson, you've learned how to use NVIDIA Nsight Systems, a powerful tool for understanding the system-level performance of your deep learning models. You've seen how to capture a performance trace, navigate its complex timeline, and use NVTX to connect it back to your source code. Most importantly, you've learned what to look for in a baseline profile: GPU idle time, the CPU-GPU interaction, and performance-killing implicit synchronizations.
Key Takeaways:
- Profiling is the first step: "You can't improve what you can't measure."
- Nsight Systems provides a holistic, system-wide view of your application's performance.
- NVTX annotations are essential for making profiler traces interpretable.
- Key analysis targets in a baseline trace are GPU idle time, data bottlenecks, and unintended synchronizations.
This lesson concludes our module on CUDA Programming Essentials. You now have both the low-level programming constructs and the high-level analysis tools needed to start your optimization journey. In the next module, Optimizing CUDA Kernels, we will zoom in. Armed with our Nsight Systems baseline, we will introduce a new tool, Nsight Compute, to dissect and optimize the performance of individual CUDA kernels at the hardware level.