Hello! Welcome to our sixth lesson in the Financial Accounting and Analysis module.
In our last session, we moved from accepting reported numbers to critically assessing them. We developed a quantitative approach to measure earnings quality using the cash-flow-to-net-income ratio and the accruals ratio. This was akin to running a profiler on a system to check its core performance—comparing the stated output (earnings) to the actual work done (cash generated).
Today, we will expand this "forensic" toolkit. The learning outcome for this lesson is to identify red flags in financial statements that may indicate accounting manipulation or earnings management. We will move beyond specific ratios to a broader set of qualitative and quantitative warning signs, learning to spot the "code smells" in financial reports that suggest something might be amiss.
1. Earnings Management vs. Fraud: A Critical Distinction
Before we hunt for red flags, we must understand the landscape. Not all accounting choices that flatter a company's performance are illegal. There is a spectrum from conservative, compliant accounting to outright fraud. "Earnings management" often occupies the grey area in between.
This first video provides a clear definition of earnings management, explains the motivations for it (both upward and downward), and gives a simple example of a perfectly legal earnings management technique.
This video from Edspira clarifies the concept of earnings management, distinguishing it from illegal fraud. It introduces the idea of 'cookie jar reserves' and provides a concrete example of how a company can legally time a transaction to smooth its earnings.
Please watch the entire video (00:00 - 08:25). Focus on the distinction between timing a transaction for economic vs. reporting purposes, and the difference between legal earnings management and illegal fraud.
As the video illustrates, earnings management involves using the flexibility within accounting rules to achieve a desired earnings figure. This is different from fabricating transactions, which is fraud. As a manager, understanding this distinction is crucial for both analyzing other companies and ensuring your own organization's reporting integrity.
2. A Systematic Framework for Identifying Red Flags
An effective analyst, much like a senior engineer conducting a code review, uses a systematic approach to spot potential issues. We will now build a checklist of common red flag areas, using a comprehensive guide from AnalystPrep.
Accounting Warning Signs | CFA Level 1
This article, 'Accounting Warning Signs,' provides a structured overview of the key areas where manipulation is most likely to occur. It will serve as the backbone for our forensic checklist.
Please read the entire article. As you read, focus on building a mental model of the key categories of red flags: Revenue, Inventory, Capitalization Policies, and the relationship between Cash Flow and Net Income. Pay attention to the specific analytical procedures suggested, such as comparing growth rates to peers and tracking ratios over time.
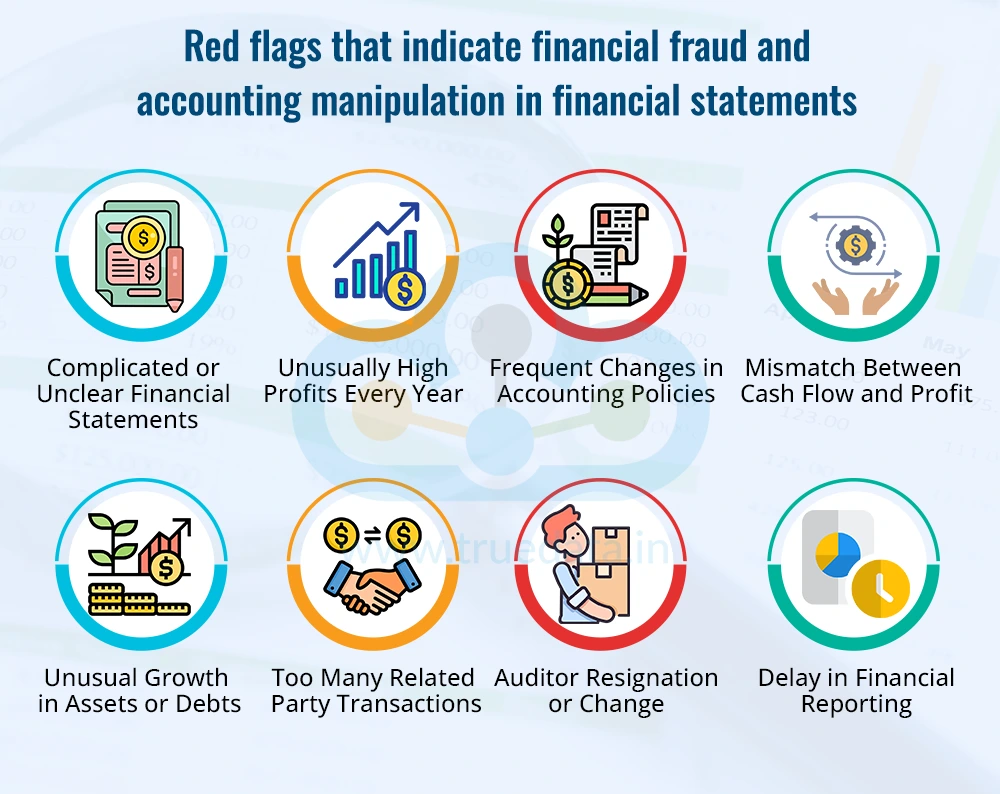
The reading provides a rich set of indicators. Let's synthesize them into a more structured framework, illustrated by some high-profile cases.
Case Studies in Manipulation
The following video brings our checklist to life by examining two of the most infamous accounting scandals: Enron and WorldCom.
Earnings Management and Financial Statement Analysis
This Edspira video provides a brief but powerful look at the Enron and WorldCom scandals. It directly illustrates two of the major red flags from our reading: aggressive revenue recognition (Enron) and improper expense capitalization (WorldCom).
Watch from the beginning to 03:47. As you watch, connect Enron's actions to the 'Pay Attention to Revenue' section of the article, and connect WorldCom's actions to the 'Pay Attention to Capitalization Policies' section.
Let's summarize the key red flags from the reading, reinforced by the cases:
-
Revenue-Related:
- Revenue growth that significantly outpaces industry peers (Enron).
- Accounts receivable growing faster than sales, leading to a rising Days Sales Outstanding (DSO). This can signal "channel stuffing" or fictitious sales.
- Aggressive or unusual revenue recognition policies (e.g., bill-and-hold sales).
-
Expense & Asset-Related:
- Improper capitalization of operating expenses as assets (WorldCom).
- Inventory growing faster than sales, suggesting potential obsolescence that hasn't been written down.
- Using more lenient depreciation methods or longer useful lives for assets compared to peers.
-
Cash Flow vs. Net Income:
- As we covered in the last lesson, a growing divergence where net income rises while cash flow from operations stagnates or falls is a classic sign of low-quality, accrual-driven earnings. The OCF/NI ratio consistently below 1.0 is a major warning.
-
Other Qualitative Indicators:
- Frequent "non-recurring" or "one-time" charges, which may be used to hide routine operating expenses.
- Frequent changes of auditors.
- A "growth-at-any-cost" culture, especially one driven by numerous acquisitions, which can strain financial controls (as noted in the Tyco example in the reading).
3. A Quantitative Synthesis: The Beneish M-Score
Given your background in quantitative modeling, you'll appreciate that these individual red flags can be combined into a formal probabilistic model. The Beneish M-Score is a well-known statistical model that uses a combination of financial ratios to estimate the likelihood that a company has manipulated its earnings.
The model was developed by Professor Messod Beneish and is essentially a probit regression model that produces a score indicating the probability of manipulation. A score greater than -2.22 is considered a potential red flag.
The M-Score is calculated as follows:
The eight variables (or "indices") are designed to capture financial statement distortions. Notice how they map directly to the red flags we've been discussing.
| Index | Name | What it Captures |
|---|---|---|
| DSRI | Days' Sales in Receivables Index | A large increase could mean improper revenue recognition. (Connects to our revenue red flags). |
| GMI | Gross Margin Index | A deteriorating gross margin creates an incentive to manipulate earnings. |
| AQI | Asset Quality Index | An increase in "soft" assets (non-PPE) relative to total assets can indicate excessive capitalization of expenses. (Connects to WorldCom). |
| SGI | Sales Growth Index | High growth can strain companies and create pressure to meet expectations, leading to manipulation. (Connects to Enron). |
| DEPI | Depreciation Index | A lower rate of depreciation (higher DEPI) could mean assets are being depreciated over longer, more aggressive useful lives. |
| SGAI | Sales, General, & Admin. Expenses Index | An increase in SGA expenses relative to sales could signal inefficiency, creating an incentive to manipulate earnings. |
| TATA | Total Accruals to Total Assets | Measures the extent to which earnings are composed of non-cash accruals. (Directly related to our previous lesson on the Accruals Ratio). |
| LVGI | Leverage Index | An increase in leverage (debt) can create pressure to meet debt covenants. |
You don't need to memorize the formula, but you should understand how it synthesizes multiple signals of potential manipulation into a single, actionable score. It's a powerful tool for screening companies and prioritizing areas for deeper due diligence. The academic paper "Detection of earnings management by different models" (resource 3ab38) provides a good overview and an applied example of this model.
4. Check Your Understanding
Let's test your ability to spot these red flags. The following questions are from the AnalystPrep article you read.
Question 1:
If a company’s revenue increases faster than the industry growth rate, even though the product quality has been decreasing and the product price has been increasing relative to the competitors’ product prices, which of the following should an analyst most likely examine?
- The trend of change in accounts receivable.
- The company's revenue recognition policies.
- Both the trend of change in accounts receivable and the company’s revenue recognition policies.
Solution
The correct answer is **3**. The scenario suggests that the reported revenue growth may not be organic. An increasing trend in accounts receivable could indicate channel stuffing or lowered credit standards to boost sales. Simultaneously, examining the revenue recognition policies is crucial to see if the company is recognizing revenue prematurely. Both should be investigated.Question 2:
Which of the following most likely indicates that a company is taking advantage of accrual accounting policies to shift current expenses to later periods?
- The ratio of cash flow from operations to net income is consistently > 1.
- The ratio of cash flow from operations to net income is consistently = 1.
- The ratio of cash flow from operations to net income is consistently < 1.
Solution
The correct answer is **3**. As we've discussed, a ratio consistently less than one signals that net income is not being converted into cash. This often happens when a company uses aggressive accrual policies, such as capitalizing costs that should be expensed, thereby deferring the recognition of expenses to future periods.Conclusion
In this lesson, we've built a comprehensive toolkit for detecting earnings management and potential accounting manipulation. We've moved from the purely quantitative metrics of the last lesson to a broader, more qualitative framework of pattern recognition, grounded in real-world examples.
Key Takeaways:
- Earnings Management is the use of accounting flexibility to achieve desired results, which is not always illegal but can obscure a company's true economic performance.
- Red Flags often appear in specific areas: aggressive revenue recognition, inventory buildups, improper expense capitalization, and growing divergences between profit and cash flow.
- Analysis is Comparative and Longitudinal: Red flags are most apparent when comparing a company's metrics to its own history and to its industry peers.
- Quantitative Synthesis is Possible: Advanced models like the Beneish M-Score can aggregate multiple warning signs into a single probabilistic score, providing a powerful screening tool.
Preview of the Next Lesson:
Having now established how to assess the quality and integrity of a company's reported financials, we will shift our focus from forensic analysis to operational efficiency. In our next lesson, we will learn to calculate the operating and cash conversion cycles using financial statement data. This will allow us to analyze how efficiently a company manages its working capital to generate sales and cash.