Hello! Welcome to our fifth lesson.
In our last session, we built a dashboard of financial ratios and used the DuPont framework to deconstruct Return on Equity. A key theme was that the inputs to these ratios, especially Net Income, are based on accounting rules and are not always a pure reflection of economic reality.
Today, we will address that issue directly. Our learning outcome is to assess the quality of a company's reported earnings using accrual-based and cash-flow-based metrics. We will move from being consumers of financial data to being critical analysts, learning how to scrutinize reported profits and separate the sustainable, cash-backed earnings from accounting noise and potential manipulation.
This is akin to debugging a complex system: the reported numbers are the output, but we need to examine the internal state and flows to verify the output's integrity.
1. Defining Quality: Reporting vs. Earnings
Before we dive into metrics, it's crucial to distinguish between two related concepts: the quality of the financial report and the quality of the earnings themselves. A report can be perfectly compliant with accounting standards (high reporting quality) but still describe a business with unsustainable, low-quality earnings.
This first video provides a clear framework for thinking about this distinction and introduces the spectrum of quality, from ideal to fraudulent.
Financial Reporting Quality (2025 Level I CFA® Exam – FRA – Module 11)
This video from AnalystPrep, based on the CFA curriculum, clearly defines financial reporting quality and earnings quality. It establishes the conceptual foundation for why we need to look deeper than the bottom-line number.
Please watch from 01:55 to 09:32. Focus on the definitions of high-quality financial reports (relevant, neutral, complete) and high-quality earnings (sustainable, provide adequate return). Also, note the spectrum of quality, from ideal to fictitious.
As the video explains:
- Financial Reporting Quality is about the integrity of the information presented. Is it compliant with GAAP/IFRS, accurate, neutral, and complete?
- Earnings Quality is about the underlying economics. Are the reported earnings sustainable and indicative of future performance? High-quality earnings are backed by cash and are not reliant on one-off events or aggressive accounting choices.
Our focus today is on measuring this second concept: earnings quality.
2. The Cash Flow "Lie Detector"
The most direct way to assess earnings quality is to compare reported profits to actual cash generated. Net income is an opinion based on accrual accounting; cash flow is a fact. A persistent divergence between the two is a major red flag.
The most common metric for this is the Operating Cash Flow to Net Income ratio.
How to Detect Earnings Quality Erosion via Cash Flow Statement
This article from Financial Modeling Prep, titled 'How to Detect Earnings Quality Erosion via Cash Flow Statement,' frames the cash flow statement as the 'ultimate lie detector.' It provides a clear, professional overview of the key cash-flow-based red flags.
Please read the introduction, the section 'Red Flags of Earnings Quality Erosion in Cash Flows,' and the FAQ section at the end. Pay close attention to the discussion on 'Declining Operating Cash Flow Despite Rising Net Income' and the definition of the OCF-to-Net-Income ratio in the FAQs.
As the article highlights, a healthy company should generate cash from its operations that is at least equal to its net income.
Key Metric: OCF to Net Income
- Interpretation: A ratio consistently at or above 1.0 is a sign of high earnings quality. It shows that reported profits are being converted into actual cash. A ratio consistently below 1.0 suggests that earnings may be inflated by non-cash items, such as aggressive revenue recognition or changes in working capital.
To see this principle in action with real-world examples of manipulation, the following video provides several compelling case studies.
5 Ways To Detect Manipulation in Financial Statements
This video from Vivek Mashrani provides practical examples of how a low conversion of profit to cash signals trouble. It visualizes the importance of this metric.
Please watch the segment from 23:10 to 26:53. The presenter discusses the 'CFO by PAT' (Profit After Tax) conversion, which is exactly the ratio we are examining. Note the case study where this ratio deteriorates over time, providing a clear warning sign before a company's collapse.
3. Quantifying Accruals: A More Technical Approach
Since Net Income = Cash Flow + Accruals, we can also assess earnings quality by measuring the size of the accrual component. The larger the portion of earnings that comes from non-cash accruals, the lower the quality. This leads us to our second key metric: the Accruals Ratio.
Given your quantitative background, you will find this approach particularly insightful. It allows us to systematically isolate the non-cash portion of earnings. There are two common ways to calculate this ratio.
Issues Related to Balance Sheet Modifications, Earnings...
This resource from AnalystPrep, aimed at CFA Level 2 candidates, provides the technical details for calculating and interpreting the Accruals Ratio. It covers both the balance sheet and cash flow statement methods and includes a detailed worked example.
Please study the sections 'Accruals Ratio' and the 'Example: Computing the Accruals Ratio.' Focus on understanding the formulas for both the balance-sheet-based and cash-flow-based ratios and how they are applied in the Philips Inc. example. This is the core technical part of our lesson.
Let's summarize the two approaches from the reading:
1. Balance Sheet Approach:
This method defines accruals as the change in Net Operating Assets (NOA).
NOA = (Total Assets - Cash & Equivalents) - (Total Liabilities - Total Debt)Balance Sheet Accruals Ratio = (NOA_{end} - NOA_{begin}) / ((NOA_{end} + NOA_{begin}) / 2)
2. Cash Flow Statement Approach:
This method defines accruals as the difference between net income and the cash flows related to operations and investing.
Cash Flow Accruals Ratio = (Net Income - CFO - CFI) / ((NOA_{end} + NOA_{begin}) / 2)
Interpretation: For both ratios, a lower value is better, indicating higher earnings quality. A consistently high or rising accruals ratio suggests that a company is increasingly relying on non-cash accounting entries to generate earnings, which may not be sustainable.
4. Application: The Quality of Earnings Report
The ultimate goal of this analysis is to arrive at a "normalized" or "sustainable" level of earnings. Analysts often summarize their findings in a Quality of Earnings (QoE) Report. This report adjusts the company's reported figures for non-recurring items, changes in accounting policies, and other distortions.
The image below shows a template for such a report. It bridges the gap between our analysis and a practical, decision-useful output.
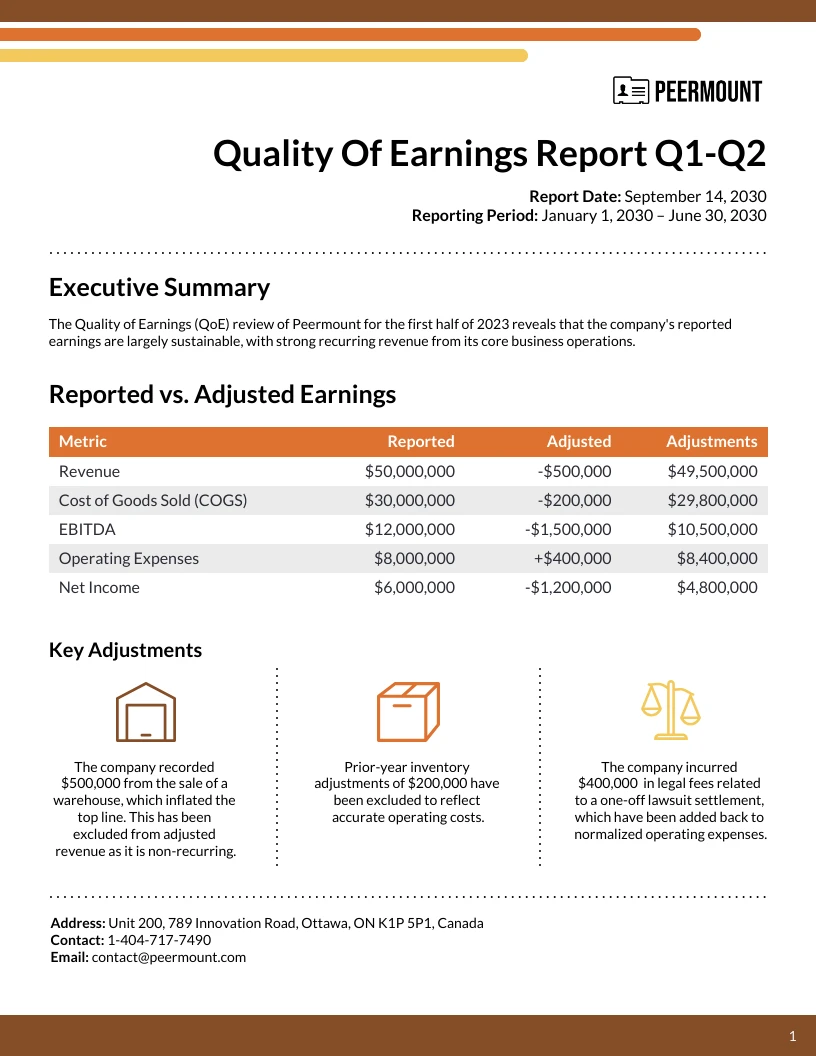
This adjusted EBITDA or Net Income is a far more reliable input for the valuation models we will encounter in Module 4.
Conclusion
Today, we've added a critical layer of skepticism and analytical rigor to our toolkit. We learned that not all earnings are created equal and developed quantitative methods to assess their quality.
Key Takeaways:
- Earnings Quality refers to the sustainability and cash-backing of reported profits.
- The OCF-to-Net-Income ratio is a powerful cash-flow-based metric. A ratio consistently above 1.0 signals strong earnings quality.
- The Accruals Ratio (calculated via balance sheet or cash flow statement) is a key accrual-based metric. A lower ratio indicates higher earnings quality, as profits are less dependent on non-cash accounting entries.
- The goal of this analysis is to derive a normalized, sustainable earnings figure, which is a more reliable indicator of a company's long-term profitability and a better input for valuation.
Preview of the Next Lesson:
We've focused on two powerful quantitative metrics for assessing earnings quality. In our next lesson, we will broaden our forensic toolkit to identify a wider range of red flags in financial statements that may indicate accounting manipulation or earnings management, covering both quantitative signals and more qualitative warning signs.