Introduction
Welcome back! In our previous lesson, we transformed raw data into clean, reliable datasets in the Silver layer by applying transformations and data quality rules. This gave us a trusted "single source of truth" for our core data entities.
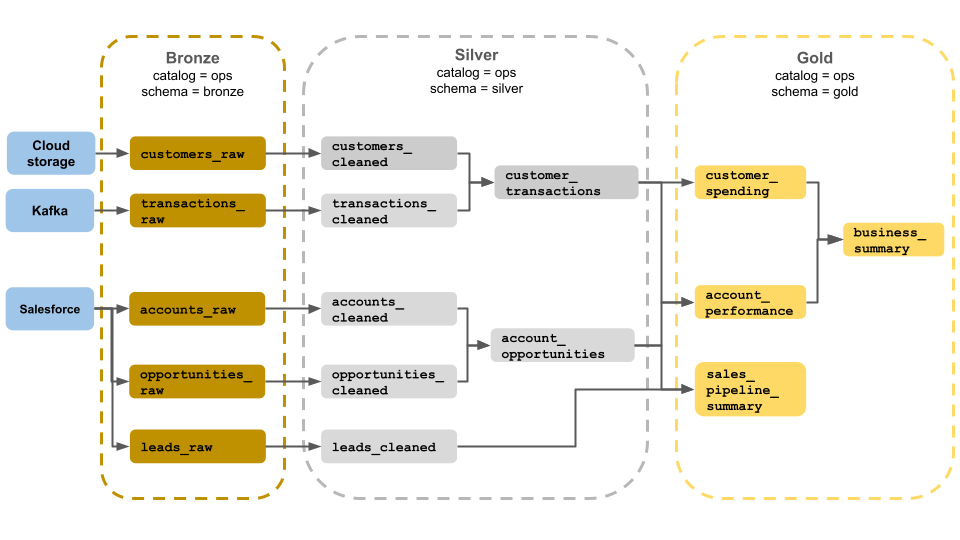
Now, we move to the final and arguably most impactful layer of the Medallion Architecture: the Gold layer. This lesson focuses on how to build an aggregated gold table for a specific business use case. Unlike the Silver layer, which is about data integrity, the Gold layer is about creating business value. We will take our cleansed data and model it into performant, aggregated tables ready for downstream consumption by BI dashboards, reporting tools, and machine learning applications.
This is where your work as a data engineer becomes directly visible to business stakeholders. Let's explore how to design and build these crucial assets in Databricks.
The Purpose and Objectives of the Gold Layer
The Gold layer is not just another storage location; it's a product designed for your data consumers. Its primary goal is to provide data in a way that is simple to query, highly performant, and directly aligned with business domains. Before we start building, it's essential to understand the design objectives that define a production-grade Gold layer.
Designing the Gold Layer in Databricks: Best Practices | DevOps.dev
To understand the strategic importance of this layer, please read the following sections from the article 'Designing the Gold Layer in Databricks: Best Practices'. It clearly outlines why the Gold layer matters and what a well-designed one should achieve.
Please read the sections titled 'Gold Layer — Semantic, Business-Ready Datasets', 'Why The Gold Layer Matters', and 'Objectives Of A Well-Designed Gold Layer'. As you read, focus on how these objectives differ from the Silver layer. Think about the trade-offs between normalization and performance.
As you've just read, the key objectives for the Gold layer are:
- Simplicity for Consumption: Tables are often denormalized (wide) to answer common business questions without requiring complex joins.
- Performance Optimization: We optimize for fast read access. Heavy computational work like joins and aggregations is done before the data lands in the Gold table.
- Auditability & Lineage: Gold tables must be trustworthy. We need to be able to trace data back to its source.
- Modular, Declarative Business Logic: A metric like "monthly recurring revenue" should have a single, clear definition implemented in one place.
- Reusability: Build domain-centric tables (e.g.,
product_sales_summary) that can serve multiple teams and use cases, rather than one-off report tables.
Given your experience building data platforms, these goals of creating optimized, business-facing data marts should be familiar. The key difference here is the specific toolset Databricks provides to achieve these goals efficiently.
Core Patterns for Aggregated Gold Tables
To meet the objectives above, we can use several design patterns. For creating aggregated tables, two patterns are particularly effective.
Designing the Gold Layer in Databricks: Best Practices | DevOps.dev
The same article provides an excellent overview of these patterns. We'll focus on two that are directly relevant to our learning outcome.
Please read the section 'Core Design Patterns For The Gold Layer', paying close attention to the subsections on 'Metric Tables' and 'Entity-Centric Fact Tables'. Note the structure and purpose of each.
- Entity-Centric Fact Tables: These tables provide a snapshot or summary of an entity (like a customer or product) over a specific time period. The grain of the table is one row per entity per time period (e.g.,
customer_id+day). - Metric Tables: These offer a highly flexible, "narrow" format where each row represents a single metric value for a specific entity at a point in time. This is very useful for time-series analysis and ML feature stores.
Let's look at a very simple, practical example of creating an aggregated Gold table.
Building the Medallion Architecture with Unity Catalog
This short blog post provides a clean, simple Spark SQL example of creating an aggregated Gold table from a Silver table.
Review the code block under the heading 'Aggregate for Business Use in the Gold Layer'. This shows a straightforward GROUP BY aggregation to count customers by email domain.
The code you just reviewed is a classic example of an aggregation:
-- This query aggregates the number of customers per email domain from the silver table.
SELECT
  SPLIT(email, '@')[1] AS email_domain,
  COUNT(*) AS user_count
FROM unity.silver.customers_cleaned
GROUP BY
  SPLIT(email, '@')[1];
This query takes the clean customers_cleaned table from the Silver layer, performs an aggregation, and produces a result that directly answers a business question: "How many users do we have from each email domain?". This is the fundamental principle of a Gold table.
Implementing Gold Tables with Delta Live Tables
While simple SQL queries work, the most robust and efficient way to build Gold tables in Databricks is by using Delta Live Tables (DLT), especially with Materialized Views (MVs).
In DLT, you have two primary types of datasets:
- Streaming Tables: Designed for append-only streaming sources. They process data incrementally as it arrives. You used these to build your Bronze and Silver tables.
- Materialized Views: The result of a query that is pre-computed. MVs are ideal for the Gold layer because they are automatically and efficiently updated when their input data changes. They are perfect for handling complex aggregations and joins that need to be kept fresh.
Let's explore this concept further.
Delta Live Tables A to Z: Best Practices for Modern Data Pipelines
This clip from the 'Delta Live Tables A to Z' presentation by Databricks clearly defines and differentiates Streaming Tables and Materialized Views. It's crucial for understanding which to use and when.
Please watch these two segments: Defining Streaming Tables vs. Materialized Views (07:44 - 09:00): Focus on the definition of MVs as pre-computed query results and their use case for aggregate reports and BI. Demo: Building an Aggregated MV (15:41 - 19:33): Watch how a materialized view is created in SQL to join and aggregate data for a BI report. Notice the use of GROUP BY ALL, a handy feature for aggregations.
As you saw, Materialized Views in DLT are incredibly powerful for the Gold layer. They abstract away the complexity of maintaining aggregates. You simply declare the final state you want, and DLT's engine (including a smart optimizer called Enzyme) figures out the most efficient way to keep it updated.
Now let's see a complete end-to-end example of building Gold tables from Silver tables in a DLT pipeline.
Build a Medallion Architecture with Databricks Lakeflow | Data Quality, Aggregation & Orchestration
This video from Thomas Hass demonstrates building several Gold tables, including one that aggregates telematics data and others that pre-join multiple Silver tables into a wide, denormalized view.
Watch the following segment (14:59 - 21:05) which covers the Gold layer creation. Pay attention to: How the code reads from Silver tables (stream(live.silver_table)). The aggregation performed on telematics data. The use of Materialized Views to create pre-joined tables for downstream applications. The final pipeline graph, showing the flow from Silver to Gold.
Here's a representative code snippet from the video, showing how to create an aggregated Gold table in Python using DLT:
import dlt
from pyspark.sql.functions import avg, col

@dlt.table(
  name="gold_aggregated_telematics",
  comment="Aggregated telematics data, averaged per device."
)
def gold_aggregated_telematics():
  return (
    dlt.read_stream("silver_telematics_clean")
      .groupBy("chassis_number")
      .agg(
        avg("speed").alias("avg_speed"),
        avg("latitude").alias("avg_latitude"),
        avg("longitude").alias("avg_longitude")
      )
  )
This code defines a Gold table that is automatically and incrementally updated whenever new data arrives in the silver_telematics_clean table. This declarative approach is central to building modern, efficient data pipelines on Databricks.
Conclusion
In this lesson, you learned how to transition from the cleansed Silver layer to the business-focused Gold layer. We've established that the Gold layer is about creating performant, reusable, and easily consumable data products for your organization.
Key Takeaways:
- The Gold layer is designed for business consumption, optimizing for read performance and ease of use by aggregating and denormalizing data.
- Entity-centric fact tables and metric tables are common, effective patterns for structuring Gold layer data to answer specific business questions.
- Delta Live Tables (DLT) Materialized Views are the recommended tool in Databricks for building aggregated Gold tables. They automatically handle incremental updates, making your pipelines more efficient and easier to maintain.
- The process involves reading from one or more Silver tables, applying business logic through joins and aggregations, and materializing the result as a Gold table.
Preview of the Next Lesson:
Our Gold tables currently represent the latest state of the business. But what happens when dimensional data changes over time? For example, what if a customer moves to a new address or a product is assigned to a new category? In the next two lessons, we will dive deep into handling these changes by implementing Type 1 and Type 2 Slowly Changing Dimensions (SCDs) in Delta Lake, a critical skill for professional data engineers.