Hello! Let's dive into the next lesson in our journey to build production-grade streaming pipelines.
In our last session, we made our pipeline robust by implementing watermarking to handle late-arriving data. This is a critical step for ensuring data correctness and managing state memory. Now that we have a resilient stream, the next logical step is to understand how to watch over it, ensuring it runs efficiently and diagnosing problems when they arise. This is what separates a development prototype from a production-ready system.
Today, our learning outcome is to monitor and troubleshoot streaming queries using the Spark UI and query progress. We'll explore the essential tools and techniques Databricks provides for observability, which is crucial for your role as a Data Engineer and a key topic for the certification exam. We will cover what metrics to look for, how to use the Spark UI to find them, and how to programmatically access query statistics for advanced monitoring and alerting.
1. Key Metrics for Streaming Observability
Before we jump into the tools, it's important to know what we're looking for. A healthy streaming pipeline is a balance of several performance factors. When a stream is slow or failing, the issue can almost always be traced back to one of these key areas.
The Databricks documentation provides an excellent summary of the key metrics you should monitor for any streaming application. Let's review them to build a mental checklist.
Read the section 'Key metrics for streaming observability' and familiarize yourself with the table of metrics. Pay special attention to Throughput, Latency, and Backpressure, as these are often the first indicators of a problem.
As you can see, monitoring isn't just about "is it running?". It's about understanding the flow of data, processing times, resource utilization, and potential bottlenecks. Now, let's look at the primary tool for investigating these metrics: the Spark UI.
2. The Spark UI: Your Primary Monitoring Dashboard
The Spark UI is an indispensable tool for debugging and optimizing any Spark application, including Structured Streaming. Given your experience with Spark, you're likely familiar with its basic components, but mastering it for streaming requires a specific focus.
To effectively use the UI, it's crucial to understand how a streaming query translates into Spark's execution model of Jobs, Stages, and Tasks.
Advancing Spark - Understanding the Spark UI
Let's start with a fantastic video from Advancing Analytics that recaps Spark's architecture and then dives deep into the Spark UI. This will provide the foundation for everything that follows.
Watch from the beginning to 16:59. The first part (until 05:24) is a great refresher on Spark's execution model. The second part demonstrates how to navigate the 'Jobs' tab and drill down into stages and tasks to find performance issues. This drill-down process is the single most important troubleshooting skill.
The Drill-Down Technique for Troubleshooting
As the video demonstrated, the core troubleshooting workflow in the Spark UI is to:
- Start at the Jobs Tab: Identify the job(s) associated with your slow or failing micro-batch.
- Drill into the Job: Click on the job description to see its Directed Acyclic Graph (DAG) and the list of stages.
- Investigate Slow Stages: Identify stages that are taking a long time to complete.
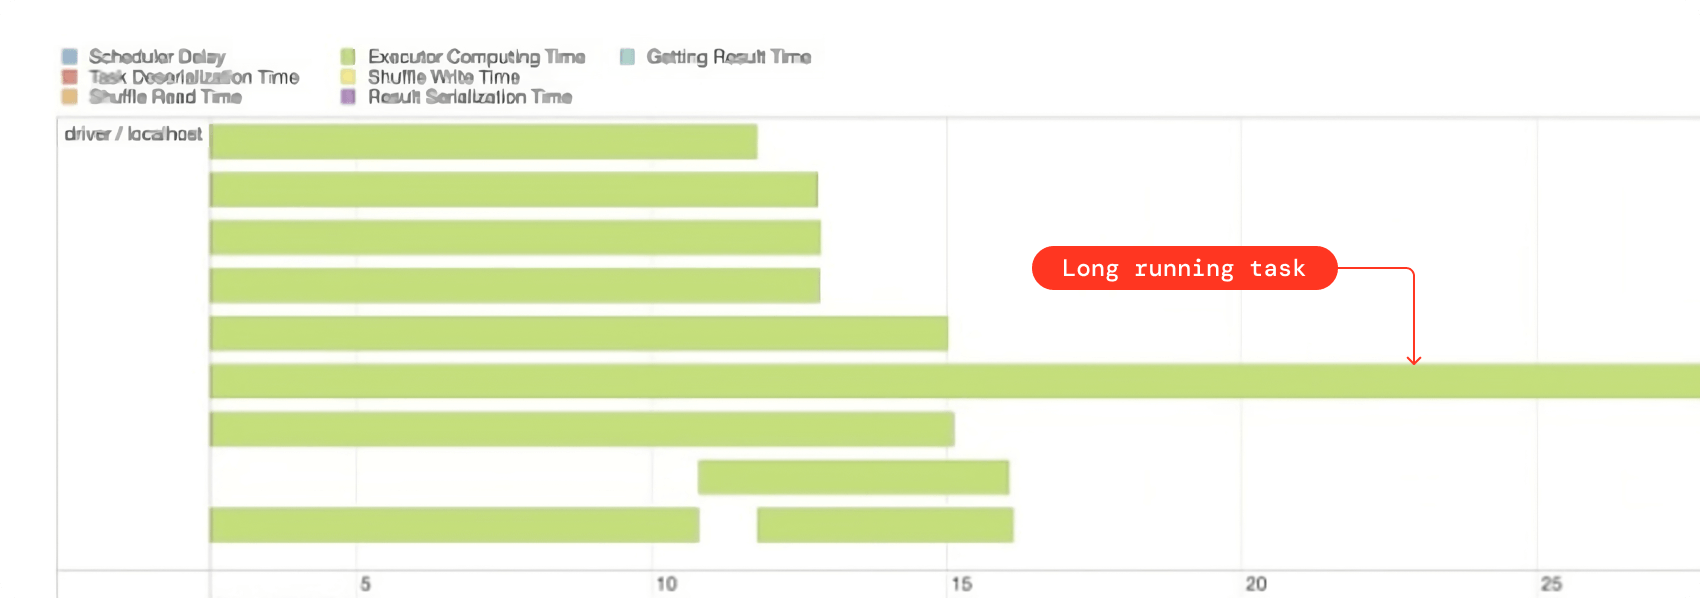
- Analyze Tasks within the Stage: Click on the slow stage to see the metrics for all its tasks. Look for "stragglers"—tasks that take much longer than the others. This is a classic sign of data skew.
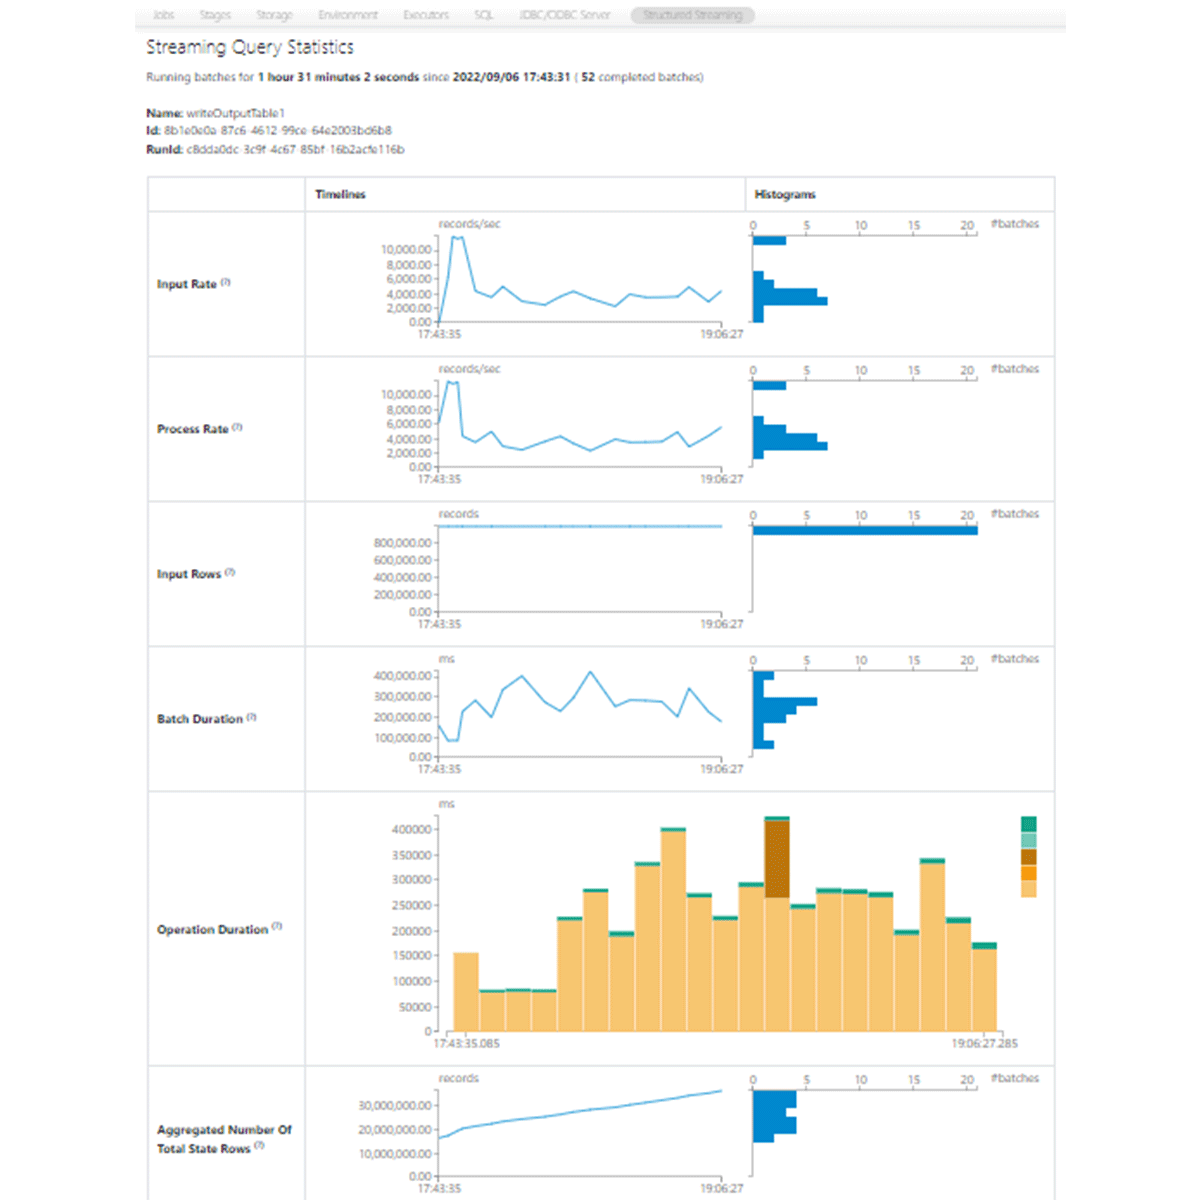
The Structured Streaming UI
While the Jobs tab is essential, Databricks provides a dedicated UI specifically for Structured Streaming that aggregates statistics across all micro-batches. This is your go-to place for a high-level overview of your stream's health over time.
This dedicated tab shows key metrics like:
- Input Rate vs. Process Rate: Is your stream keeping up with the data source? If the input rate consistently exceeds the process rate, your backlog is growing, and latency will increase.
- Batch Duration: How long is each micro-batch taking? Spikes in this duration can indicate intermittent problems.
- State Store Memory: For stateful operations (like the windowed aggregations we did with watermarking), this chart tracks the size of your state. Uncontrolled growth here points to issues with watermarking or state cleanup.
A common challenge is linking the high-level metrics in the Streaming tab back to the specific Spark Jobs.
Streaming in Production: Collected Best Practices, Part 2
This Databricks blog post explains how to connect the dots between the Streaming UI and the Jobs tab.
Read the four paragraphs starting with 'Just like troubleshooting a batch job...'. Focus on how to use the stream's name or ID to filter and find the corresponding jobs on the Jobs tab.
3. Programmatic Monitoring of Query Progress
The Spark UI is fantastic for interactive debugging, but for production systems, you often need to monitor programmatically. This allows you to build custom dashboards, trigger automated alerts, or log performance metrics over time. Structured Streaming offers two main ways to do this.
Method 1: Inspecting the StreamingQuery Object
When you start a stream, the .writeStream.start() call returns a StreamingQuery object. You can use this object to interact with the running query, including pulling its latest progress metrics. This is a quick and easy way to check on a stream within a Databricks notebook.
Advancing Spark - Databricks Delta Streaming
Let's watch a clip that demonstrates how to capture this StreamingQuery object and inspect its progress.
Watch from 07:55 to 14:06. Pay attention to how the stream writer is assigned to a variable, and then methods like .lastProgress and .recentProgress are used to extract metrics like numInputRows directly into a DataFrame.
Here's a quick code example summarizing the pattern:
# Start the stream and assign it to a variable
streaming_query = (
  my_streaming_df
    .writeStream
    .format("delta")
    .outputMode("append")
    .option("checkpointLocation", "/path/to/checkpoint")
    .start("/path/to/output")
)


# In another cell, you can inspect the progress
last_progress = streaming_query.lastProgress
print(last_progress)


# You can also get the query status
status = streaming_query.status
print(status)
Method 2: Using a StreamingQueryListener
For more robust, decoupled monitoring, you can attach a custom listener to the Spark session. This listener will be automatically notified of events in the stream's lifecycle (onQueryStarted, onQueryProgress, onQueryTerminated).
This is the preferred method for production scenarios where you want to export metrics to an external monitoring system like Prometheus, Datadog, or a logging service.
The Databricks documentation provides a clear, boilerplate Python example for creating and attaching a StreamingQueryListener.
Review the sections 'Example: Export metrics to external monitoring tools' and 'Example: Use query listener within Databricks'. Focus on the structure of the MyListener class and look at the example JSON output to see the rich detail available in the event.progress object.
4. Common Troubleshooting Scenarios
Now that we know the tools, let's connect them to common problems. Most streaming issues fall into two categories: failures (the stream stops) and latency (the stream is too slow).
Streaming in Production: Collected Best Practices, Part 2
This blog post provides a concise list of common causes for both failure and latency scenarios.
Read the 'Failure Scenarios' and 'Latency Scenarios' sections. For each cause listed, think about which tool or metric we've discussed would help you diagnose it.
Here is a summary table connecting those common problems to the diagnostic tools we've learned about:
| Problem Scenario | Common Cause | How to Diagnose |
|---|---|---|
| Failure | Driver Out-of-Memory (OOM) | Too many streams on one cluster, or using .collect(). Check the Ganglia UI or Executors tab for high driver memory/CPU. |
| Failure | Executor Out-of-Memory (OOM) | Cluster is too small or has a poor memory-to-core ratio. Check the Executors tab for failed executors and error logs. |
| Latency | Data Skew | Uneven data distribution. Use the Jobs -> Stages -> Tasks drill-down in the Spark UI to find long-running tasks. |
| Latency | Growing State | Stateful query without a watermark or with too long a delay. Monitor the 'Aggregated Number Of Total State Rows' in the Structured Streaming UI. |
| Latency | Slow Sink | The destination can't write as fast as the stream processes data. Check the addBatch duration in the Streaming UI or lastProgress JSON. |
| Latency | Backpressure | The source has more data than the stream can process. Monitor the inputRate vs. processRate in the Streaming UI. |
Conclusion
Congratulations! You now have a comprehensive toolkit for observing and managing your Structured Streaming jobs. This is a fundamental skill for any data engineer working with real-time pipelines on Databricks.
Key Takeaways:
- Know Your Metrics: Always start with an understanding of key metrics like throughput, latency, and backpressure.
- Master the Spark UI: The UI is your primary tool. The drill-down workflow (Jobs -> Stages -> Tasks) is essential for pinpointing bottlenecks like data skew.
- Use the Streaming Tab: Leverage the dedicated Structured Streaming UI for a high-level, historical view of your stream's health and to monitor input/process rates.
- Monitor Programmatically: For automation and alerting, use the
StreamingQueryobject for quick checks or aStreamingQueryListenerfor robust, production-grade monitoring. - Connect Problems to Tools: Learn to recognize common failure and latency patterns and map them to the specific metrics and UI components that will reveal the root cause.
Preview of the Next Lesson:
So far, we have been building and monitoring streaming pipelines using the core Structured Streaming APIs. This gives you maximum control but also requires you to manage many components manually (e.g., checkpoints, schema evolution, monitoring).
In our next module, we will explore Delta Live Tables (DLT). DLT is a declarative framework that automates much of this complexity. You'll see how DLT simplifies pipeline development and comes with its own powerful, built-in observability features that handle much of the monitoring we discussed today automatically.