Welcome! In our last lesson, you learned to identify the standard symbols used in Entity-Relationship Diagrams (ERDs), giving you the vocabulary to "read" a database blueprint. We covered both Chen and Crow's Foot notations for entities, attributes, and relationships.
Today, we transition from reading to writing. You'll apply that knowledge to draw your first ERD. This lesson focuses on the most common relationship type you'll encounter: the one-to-many (1:M) relationship. Our goal is to take a simple business scenario, analyze it, and translate it into a complete and correct ERD.
1. What is a One-to-Many Relationship?
Before we start drawing, let's solidify our understanding of what a one-to-many relationship is. In simple terms, it's a link between two entities where one instance of the first entity can be associated with many instances of the second, but each instance of the second entity is associated with only one instance of the first.
A classic example is DEPARTMENT and EMPLOYEE. One DEPARTMENT can have many EMPLOYEEs, but each EMPLOYEE belongs to only one DEPARTMENT.
In this structure, we often use specific terminology:
- Parent Table: The table on the "one" side of the relationship (e.g.,
DEPARTMENT). - Child Table: The table on the "many" side of the relationship (e.g.,
EMPLOYEE).
To learn more about this fundamental concept, please read the following brief sections from an article by DataCamp.
One-to-Many Relationship in Databases: A Complete Guide
This reading clearly defines the one-to-many relationship and introduces the parent/child terminology.
Read the first two main sections: What Is a One-to-Many Relationship? Focus on the definition and the parent/child table concept. Understanding Cardinality in One-to-Many Relationships. This will reinforce what you learned about minimum and maximum cardinality in a previous lesson, but now applied specifically to the 1:M context.
To see this concept explained with another common example (customers and orders), watch this short introductory clip.
Database Design One to Many Relationships: 7 Steps to Create Them (With Examples)
The video "Database Design One to Many Relationships" introduces the concept with a practical business case.
Watch the segment from the beginning, where the presenter defines a one-to-many relationship using the example of customers and orders.
2. A Step-by-Step Guide to Drawing a 1:M ERD
Now that we understand the "what," let's focus on the "how." Drawing an ERD for a 1:M relationship involves a clear, repeatable process. We will focus on using Crow's Foot notation, as its symbols for cardinality are very explicit and widely used.
The following video provides an excellent, structured method for turning a business requirement into a diagram. We will use its steps as our guide.
Database Design One to Many Relationships: 7 Steps to Create Them (With Examples)
This video from Database Star breaks down the process of identifying and drawing a 1:M relationship into clear, manageable steps.
Watch from Step 2 to Step 7. Pay close attention to the following key actions: Identifying objects (entities) from a sentence. The crucial questioning technique: "Does object one have many object twos, or does object two have many object ones?" This question is the key to determining the relationship type. The process of drawing the entity boxes, connecting them with a line, and finally, adding the Crow's Foot symbol to the "many" side of the relationship.
To reinforce this process, here is a summary of the steps you should follow:
- Identify the Entities: From the business scenario, identify the main nouns or objects. These will become your entities (e.g.,
Customer,Order). - Determine the Relationship: Use the question from the video to figure out which entity is the "one" and which is the "many". For example, "Does a
Customerhave manyOrders, or does anOrderhave manyCustomers?" The answer that makes logical sense reveals the relationship. - Draw the Entity Rectangles: Draw a rectangle for each entity, with the entity name at the top.
- Connect the Entities: Draw a single line connecting the two rectangles.
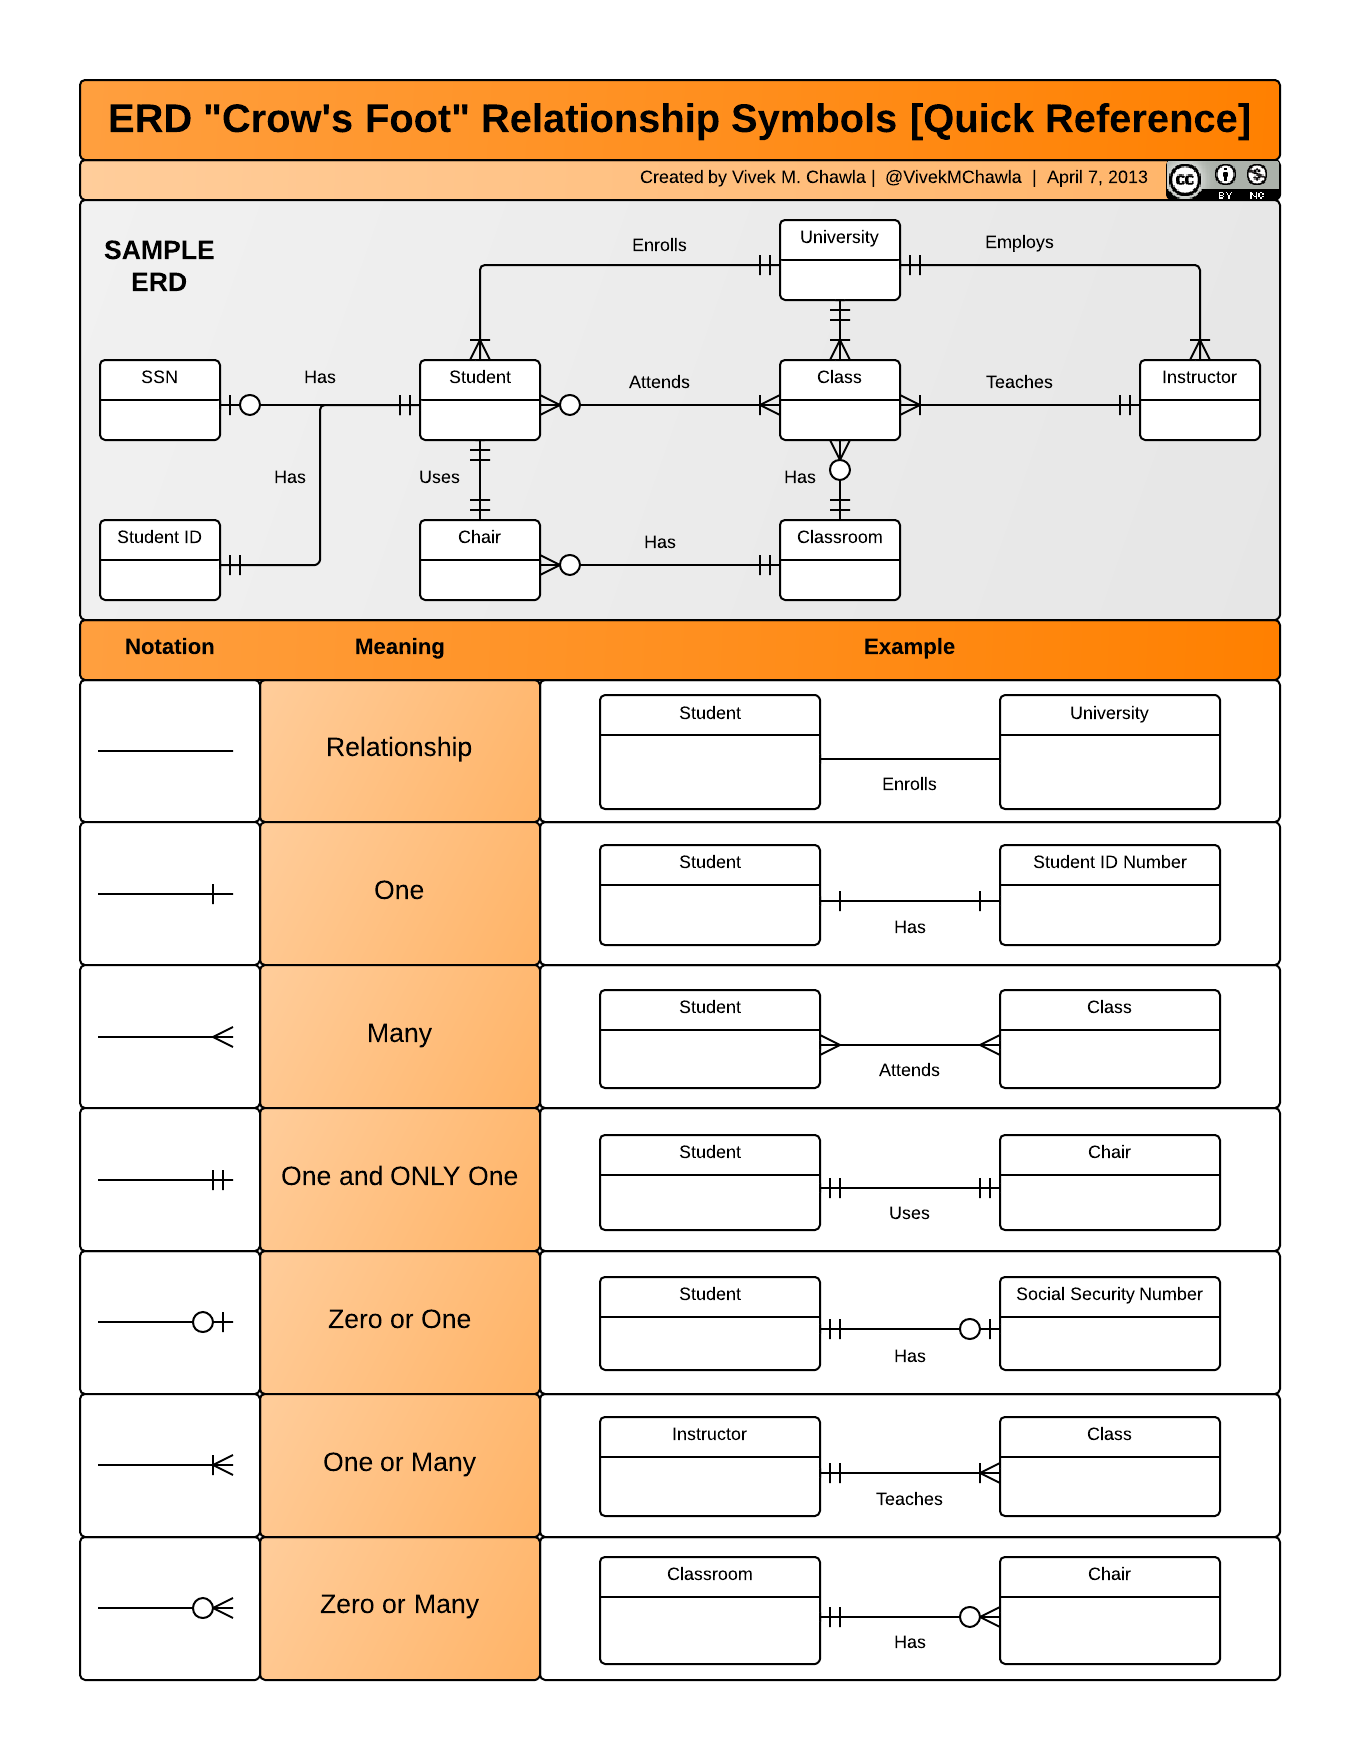
- Add Cardinality Symbols: This is the most critical step. Add the Crow's Foot symbols to the ends of the line to represent the cardinality you determined in step 2. The "crow's foot" (
<) goes on the "many" side.
The image below is a useful reference for the different Crow's Foot symbols and their meanings, which you saw in the last lesson.
3. Practical Application: University Departments
Let's apply this process to a new, simple scenario.
Scenario: A university needs a database to track its academic departments and the professors who work in them. Each professor must be assigned to exactly one department. A department may have many professors, or it might be a new department with no professors assigned yet.
Let's walk through the steps together.
Step 1: Identify the Entities
The main objects in the scenario are DEPARTMENT and PROFESSOR.
Step 2: Determine the Relationship
Let's ask the question:
- Does a
DEPARTMENThave manyPROFESSORs, or does aPROFESSORhave manyDEPARTMENTs? - The business rules state, "A department may have many professors," and "Each professor must be assigned to exactly one department."
- Therefore, the relationship is one-to-many from
DEPARTMENTtoPROFESSOR.
Step 3 & 4: Draw and Connect the Entities
We draw two rectangles, one for DEPARTMENT and one for PROFESSOR, and connect them with a line.
Step 5: Add Cardinality Symbols
Now we refine the line with symbols based on the business rules.
-
Relationship from
DEPARTMENTtoPROFESSOR:- Maximum: A
DEPARTMENTcan have "many"PROFESSORs. We use the crow's foot symbol (<). - Minimum: A
DEPARTMENT"might be new with no professors." This means it can have zero professors. We use the circle symbol (O) for optional participation. - The symbol on the
PROFESSORside is zero or many (O<).
- Maximum: A
-
Relationship from
PROFESSORtoDEPARTMENT:- Maximum: A
PROFESSORis assigned to "exactly one"DEPARTMENT. We use the single stroke (|). - Minimum: A
PROFESSOR"must be assigned to exactly one"DEPARTMENT. This means it cannot exist without a department, so the minimum is also one. We use another single stroke (|). - The symbol on the
DEPARTMENTside is one and only one (||).
- Maximum: A
Putting it all together, the relationship line would look like this:
DEPARTMENT ||-------O< PROFESSOR
This diagram visually communicates that one department can have zero or many professors, and each professor must belong to one and only one department.
Conclusion
In this lesson, you've taken a significant step from theory to practice. You learned a systematic process for analyzing a business scenario and drawing a one-to-many (1:M) relationship using Crow's Foot notation.
Key Takeaways:
- A one-to-many (1:M) relationship links a single record in a parent table to multiple records in a child table.
- To identify the relationship, ask the question: "Does entity A have many Bs, or does entity B have many As?"
- In Crow's Foot notation, the relationship is drawn as a line connecting the entities, with the "crow's foot" symbol (
<) placed on the "many" side. - Participation (optional
Ovs. mandatory|) is determined by the minimum number of associations allowed by the business rules.
You now have the fundamental skill to model the most common type of database relationship. In our next lesson, we will continue to build on this skill by examining and drawing another type: the one-to-one (1:1) relationship. You'll see that the process is nearly identical, only the cardinality symbols change.