Hello! Welcome to your third lesson.
In the last two lessons, we built a foundational understanding of a neural network's structure and mechanics. We started by defining an artificial neuron and an MLP, and then in the previous lesson, we traced the path of data through the network in a forward pass, seeing how an input vector is transformed into an output vector through a series of matrix multiplications and non-linear activations.
However, a network with random initial weights will produce random, meaningless outputs. The core of machine learning is not just making predictions, but making good predictions. To do that, the network needs to learn from its mistakes. This raises a crucial question: how do we mathematically measure a "mistake"?
Today, we will answer that question. Our goal is to define a loss function, a critical component that quantifies the error between the network's prediction and the actual, desired outcome. Specifically, we'll focus on cross-entropy loss, a function deeply rooted in information theory that is the cornerstone of training classification models, including the large language models we're working towards.
1. From Raw Outputs to Probabilities: The Softmax Function
The forward pass ends with a vector of raw numerical values, often called logits. For a classification task (e.g., predicting the next word in a sentence from a vocabulary of 50,000 words), these raw scores aren't very useful. We need to convert them into a set of probabilities, where each value is between 0 and 1, and all values sum to 1.
This is the job of the Softmax function. It takes a vector of real numbers and normalizes it into a probability distribution over possible outcomes.
The video below gives a clear explanation of how the final layers of a neural network produce these probabilities.
What is the difference between negative log likelihood and cross entropy? (in neural networks)
Let's watch a segment from Herman Kamper's video 'What is the difference between negative log likelihood and cross entropy?'. This part introduces the neural network structure and explains the role of the Softmax function.
Watch from 00:28 to 02:41. Pay close attention to how the raw output vector z is transformed into a probability vector by the Softmax function. Understand why this normalization is a necessary step before we can evaluate the model's prediction.
Mathematically, if our network produces a logit vector , the Softmax function calculates the -th component of the output probability vector as:
The exponential function, , ensures all output values are positive. Dividing by the sum of all these exponentiated values ensures that the final probabilities sum to 1. Now, our network's output is a valid probability distribution, which we can compare to the true distribution.
2. Quantifying Error with Information Theory
How do we measure the "error" between our predicted probability distribution () and the true distribution ()? We can find a powerful answer in the field of information theory.
The key idea is surprise. Intuitively, if a very unlikely event occurs, we are more surprised than if a very likely event occurs. Information theory quantifies surprise for an event with probability as .
From this, we can define cross-entropy, which measures the average surprise we experience when observing events from a true probability distribution , while our beliefs about their likelihood are described by a different distribution . This is precisely our scenario: we observe the real world (distribution ) while using our model's predictions (distribution ) to estimate probabilities.
The following video masterfully builds these concepts from the ground up.
The Key Equation Behind Probability
The video 'The Key Equation Behind Probability' by Artem Kirsanov provides an excellent, mathematically-grounded explanation of surprise, entropy, and cross-entropy.
Please watch from 10:17 to 19:05. Part 1 (10:17 - 13:52): Focus on the definition of 'surprise' as a function of probability, \log(1/p), and how this leads to 'entropy' as the average surprise of a single distribution. Part 2 (13:52 - 19:05): This section defines cross-entropy. Grasp the core idea that cross-entropy measures the average surprise when using an approximate model (Q) to predict outcomes from a true distribution (P). Note its asymmetry.
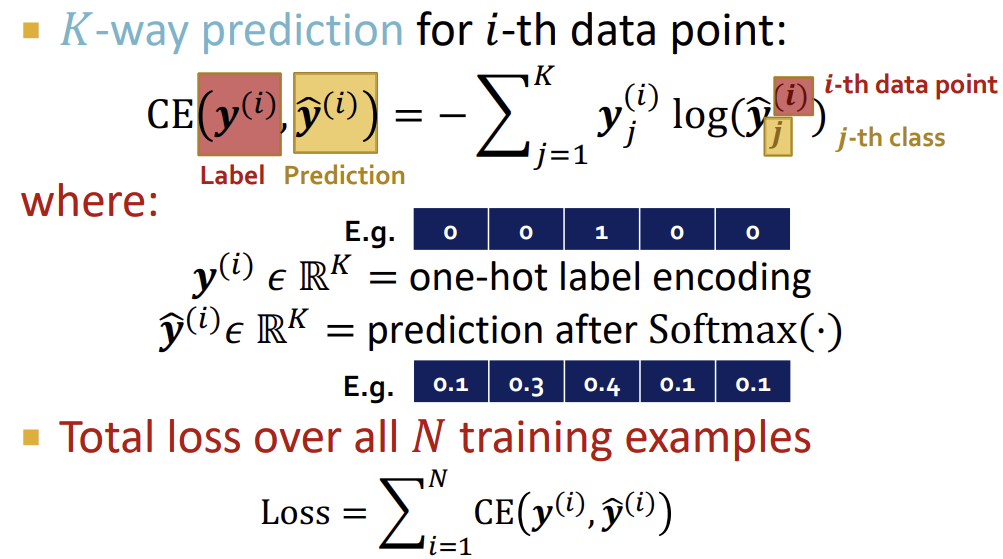
The mathematical formula for the cross-entropy between a true discrete distribution and a model's predicted distribution is:
Here, is the number of possible classes or outcomes. This formula calculates a weighted average of the surprise () for each outcome, where the weights are the true probabilities . Our goal in training a neural network will be to adjust its parameters to make this cross-entropy value as small as possible.
3. Cross-Entropy as a Neural Network Loss Function
Let's now apply this formal definition directly to our neural network. In a typical classification problem:
- The true distribution is represented by a one-hot vector . For example, if we have 5 classes and the correct class is the 3rd one, then . This means and for all other .
- The predicted distribution is the output of our Softmax layer, .
Because the true distribution vector is all zeros except for a single 1 at the correct class index (let's call it ), the big sum in the cross-entropy formula collapses into a single term:
This beautifully simple result is the negative log probability of the correct class. It has a powerful and intuitive meaning: to minimize the loss, the network must learn to maximize the probability it assigns to the correct answer. This is also known as maximizing the log-likelihood of the data, a concept you might have encountered in statistical modeling.
The following video connects these pieces and shows why cross-entropy and negative log-likelihood are, in this context, the same objective.
What is the difference between negative log likelihood and cross entropy? (in neural networks)
Let's return to Herman Kamper's video. He will now derive the negative log likelihood loss and show that it is mathematically identical to the cross-entropy loss we just defined.
Watch from 02:41 to 09:01. The derivation here is key. Follow how he: Defines the negative log likelihood (NLL) for the training data. Simplifies the NLL expression using a one-hot vector representation for the true label. Compares this final expression to the formal definition of cross-entropy to show they are equivalent.
The behavior of this loss function is exactly what we want. Look at the plot below for a binary classification task (two outcomes, 0 or 1).
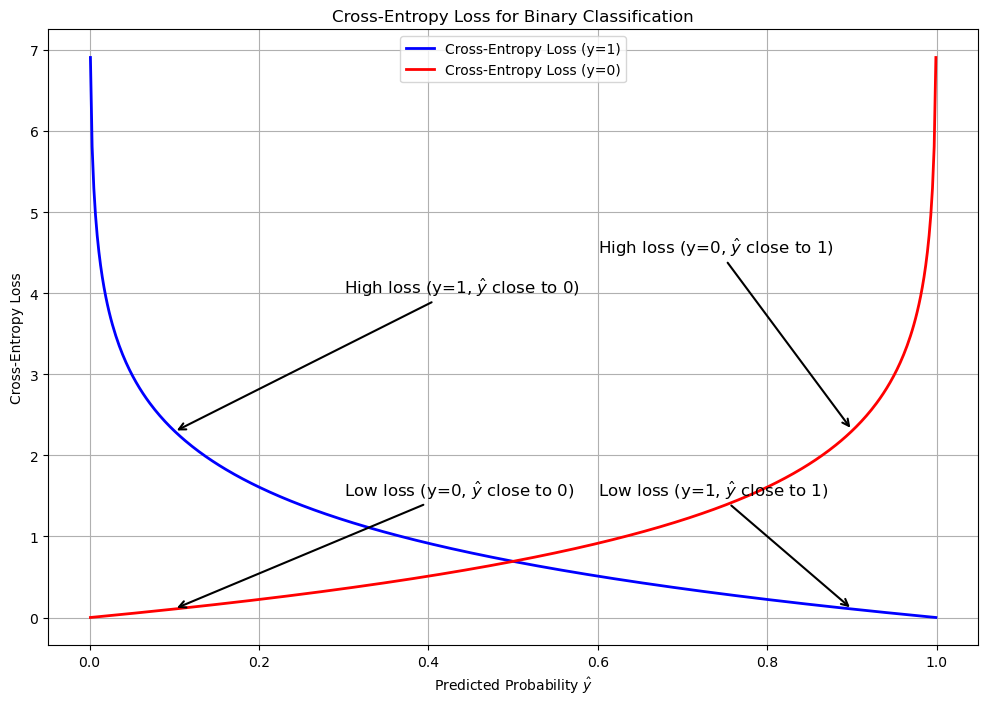
As you can see, the loss penalizes the model heavily for being confident and wrong (e.g., predicting 0.01 when the answer is 1 results in a very high loss), while rewarding it for being confident and correct.
Test your understanding!
Suppose we are building a language model to predict the next word. For a given context, the true next word is "fox" (index 2 in our tiny vocabulary). The network's logits are . The vocabulary is ["the", "quick", "fox", "jumps"].
- Calculate the predicted probability distribution by applying the Softmax function to .
(You can use a calculator. ) - What is the one-hot encoded true label vector ?
- Calculate the cross-entropy loss for this single prediction using the simplified formula . Use the natural logarithm ().
Show answer
-
Calculate Softmax:
- First, find the sum of the exponentiated logits:
- Now, divide each exponentiated logit by the sum:
The model predicts "fox" with ~79.6% probability.
- First, find the sum of the exponentiated logits:
-
One-hot vector:
The vocabulary is["the", "quick", "fox", "jumps"]. Since the correct word is "fox" (index 2), the one-hot vector is: -
Calculate Loss:
The correct class index is . The predicted probability for this class is .
The cross-entropy loss for this prediction is approximately 0.228.
4. Why Cross-Entropy? The Link to KL Divergence
You might be wondering if other loss functions could work. Why is cross-entropy so prevalent? The final piece of the puzzle lies in its relationship to another information-theoretic measure: Kullback-Leibler (KL) Divergence.
KL Divergence, , measures the "extra surprise" you get from using distribution to model distribution . It's a direct measure of how much information is lost when is used to approximate . Our goal in training is to find a model that is as close as possible to the true data distribution , which means we want to minimize .
The relationship between KL Divergence and Cross-Entropy is simple and profound:
Where is the cross-entropy and is the entropy of the true distribution .
In a machine learning task, the true data distribution is fixed. We can't change it. This means its entropy, , is a constant. Therefore, minimizing the KL Divergence is mathematically equivalent to minimizing the cross-entropy. Since cross-entropy is easier to compute, it becomes our practical optimization objective.
The Key Equation Behind Probability
This final clip from Artem Kirsanov's video explains this crucial link between cross-entropy and KL Divergence, justifying why minimizing cross-entropy is the right objective for training our model.
Watch from 19:05 to 24:34. This section explains how minimizing KL Divergence, our ultimate goal, is equivalent to minimizing cross-entropy because the entropy of the true data distribution is a constant. This provides the theoretical justification for our choice of loss function.
Conclusion
In this lesson, we have built the crucial bridge between making a prediction and evaluating it. We've established a principled, mathematically sound method for quantifying our model's error.
Key Takeaways:
- A loss function computes a numerical score that represents the error between a model's prediction and the ground truth.
- The Softmax function is used to convert the raw output logits of a classifier into a valid probability distribution.
- Cross-entropy loss is derived from information theory and measures the "average surprise" when comparing the model's predicted distribution to the true distribution.
- For classification, cross-entropy simplifies to the negative log-likelihood of the correct class. Minimizing this loss encourages the model to assign a high probability to the correct answer.
- Optimizing for cross-entropy is equivalent to minimizing the KL Divergence between the model's distribution and the true data distribution, which is the ultimate goal of training.
We now have a complete forward path: an input goes in, a prediction comes out, and a single number—the loss—tells us how good that prediction was. The entire network is just one giant, differentiable function.
This leads to the final, most important question: How do we use this loss value to systematically update the millions of weights and biases in the network to improve its performance? That is the subject of our next and final lesson in this module: backpropagation and gradient descent.