Welcome back! In our previous lesson, we developed a strong geometric intuition for Principal Component Analysis, seeing it as a rotation of the coordinate system to align with the axes of maximum variance.
This lesson bridges that geometric picture with a rigorous algebraic foundation. We will formally prove the relationship between the PCA solution and the eigendecomposition of the covariance matrix. By the end of this lesson, you will be able to:
- Relate the PCA solution to the eigendecomposition of the covariance matrix.
We will demonstrate that the principal components are precisely the eigenvectors of the covariance matrix, and the variance explained by each component is the corresponding eigenvalue. This connection provides a concrete computational "recipe" for performing PCA, which we will implement in the next lesson.
1. The Goal: Diagonalizing the Covariance Matrix
Let's begin by formalizing our objective. We have a mean-centered data matrix of size , where is the number of samples and is the number of features. The sample covariance matrix is given by:
The diagonal elements of represent the variance of each feature, while the off-diagonal elements represent the covariance between pairs of features. Our data is "correlated" if the off-diagonal elements are non-zero.
The goal of PCA is to find a new set of coordinates (a new basis) in which the data is uncorrelated. This means we are looking for an orthonormal transformation matrix that rotates our data into a new representation , such that the covariance matrix of , let's call it , is a diagonal matrix.
This goal of removing redundancy by diagonalizing the covariance matrix is central to PCA. The following reading explains this motivation clearly.
A Tutorial on Principal Component Analysis
The tutorial 'A Tutorial on Principal Component Analysis' provides a clear motivation for PCA's objective. It discusses how we want to transform the data to minimize redundancy (off-diagonal terms) and maximize signal (diagonal terms).
Please read Section IV, 'Variance and the Goal' (pages 4-7), focusing on subsections B, C, and D ('Redundancy', 'Covariance Matrix', and 'Diagonalize the Covariance Matrix'). This will solidify the idea that our mathematical goal is to find a transformation that makes the covariance matrix diagonal.
2. The Solution: Eigendecomposition
So, how do we find the rotation matrix that diagonalizes the covariance matrix? The answer lies in a cornerstone of linear algebra: the eigendecomposition of a symmetric matrix.
The process of diagonalizing the covariance matrix is mathematically analogous to finding the principal axes of an inertia tensor in mechanics. In both scenarios, we seek an orthonormal basis (eigenvectors) where a symmetric tensor (covariance or inertia) becomes diagonal, revealing the principal directions of variance or inertia.
Let's derive this solution. We start with the covariance matrix of the transformed data :
Our goal is to choose such that is diagonal.
Here's the crucial insight: a real symmetric matrix (like our covariance matrix ) can always be diagonalized by a matrix of its orthonormal eigenvectors. This is a result of the Spectral Theorem. The eigendecomposition of is:
where:
- is an orthogonal matrix whose columns are the eigenvectors of .
- (Lambda) is a diagonal matrix whose entries are the corresponding eigenvalues of .

Now, let's make a strategic choice for our transformation matrix . What if we choose to be the matrix of eigenvectors, ? Let's substitute into our expression for :
Now, substitute the eigendecomposition of :
Since is an orthogonal matrix, we know that (the identity matrix). This simplifies our expression beautifully:
This is the central result. By choosing our transformation matrix to be the matrix of eigenvectors of the original covariance matrix , the covariance matrix of the new data becomes the diagonal matrix of eigenvalues .
This means:
- The principal components (the new axes) are the eigenvectors of the covariance matrix .
- The variances of the data along these new axes are the eigenvalues of . Since the new covariance matrix is diagonal, the transformed features are uncorrelated.
The following resources provide excellent, rigorous derivations of this exact result.
A Tutorial on Principal Component Analysis - Solving PCA
The tutorial PDF we looked at earlier also contains this exact derivation. It's a concise and powerful algebraic proof.
Please read Section V, 'SOLVING PCA: EIGENVECTORS OF COVARIANCE' (page 7). It walks through the same derivation we just did, confirming our findings.
Principal Component Analysis - Formalizing the objective function
For another perspective, this blog post by Gregory Gundersen arrives at the same conclusion by starting from the variance maximization problem we formulated in the first lesson. It's a beautiful demonstration that both paths lead to the same answer.
Read the section '2. Formalizing the objective function'. You don't need to follow every single algebraic step, but notice how the problem of maximizing variance is transformed until it reveals that the optimal solution is the first eigenvector of the covariance matrix.
3. The PCA Algorithm: A Summary
The relationship between PCA and eigendecomposition gives us a straightforward algorithm for finding the principal components of a dataset.
Principal Component Analysis (PCA)
This short video provides a quick, animated summary of the result we've just derived.
Watch the segment from 2:26 to 3:24. It shows how maximizing the projected variance leads directly to the eigenvalue equation, summarizing our entire lesson in under a minute.
Here is the computational "recipe" for PCA:
- Organize Data: Arrange your data into an matrix .
- Mean-Center: For each feature (column), subtract its mean.
- Compute Covariance: Calculate the covariance matrix .
- Eigendecomposition: Compute the eigenvectors and eigenvalues of .
- Identify Principal Components: The eigenvectors are the principal components. Sort them in descending order according to their corresponding eigenvalues. The eigenvector with the largest eigenvalue is PC1, the second largest is PC2, and so on.
- Transform Data: Project the original centered data onto the new axes by multiplying it by the matrix of sorted eigenvectors: . The columns of are the principal component scores.
4. Self-Assessment
Let's test your understanding with a practical problem.
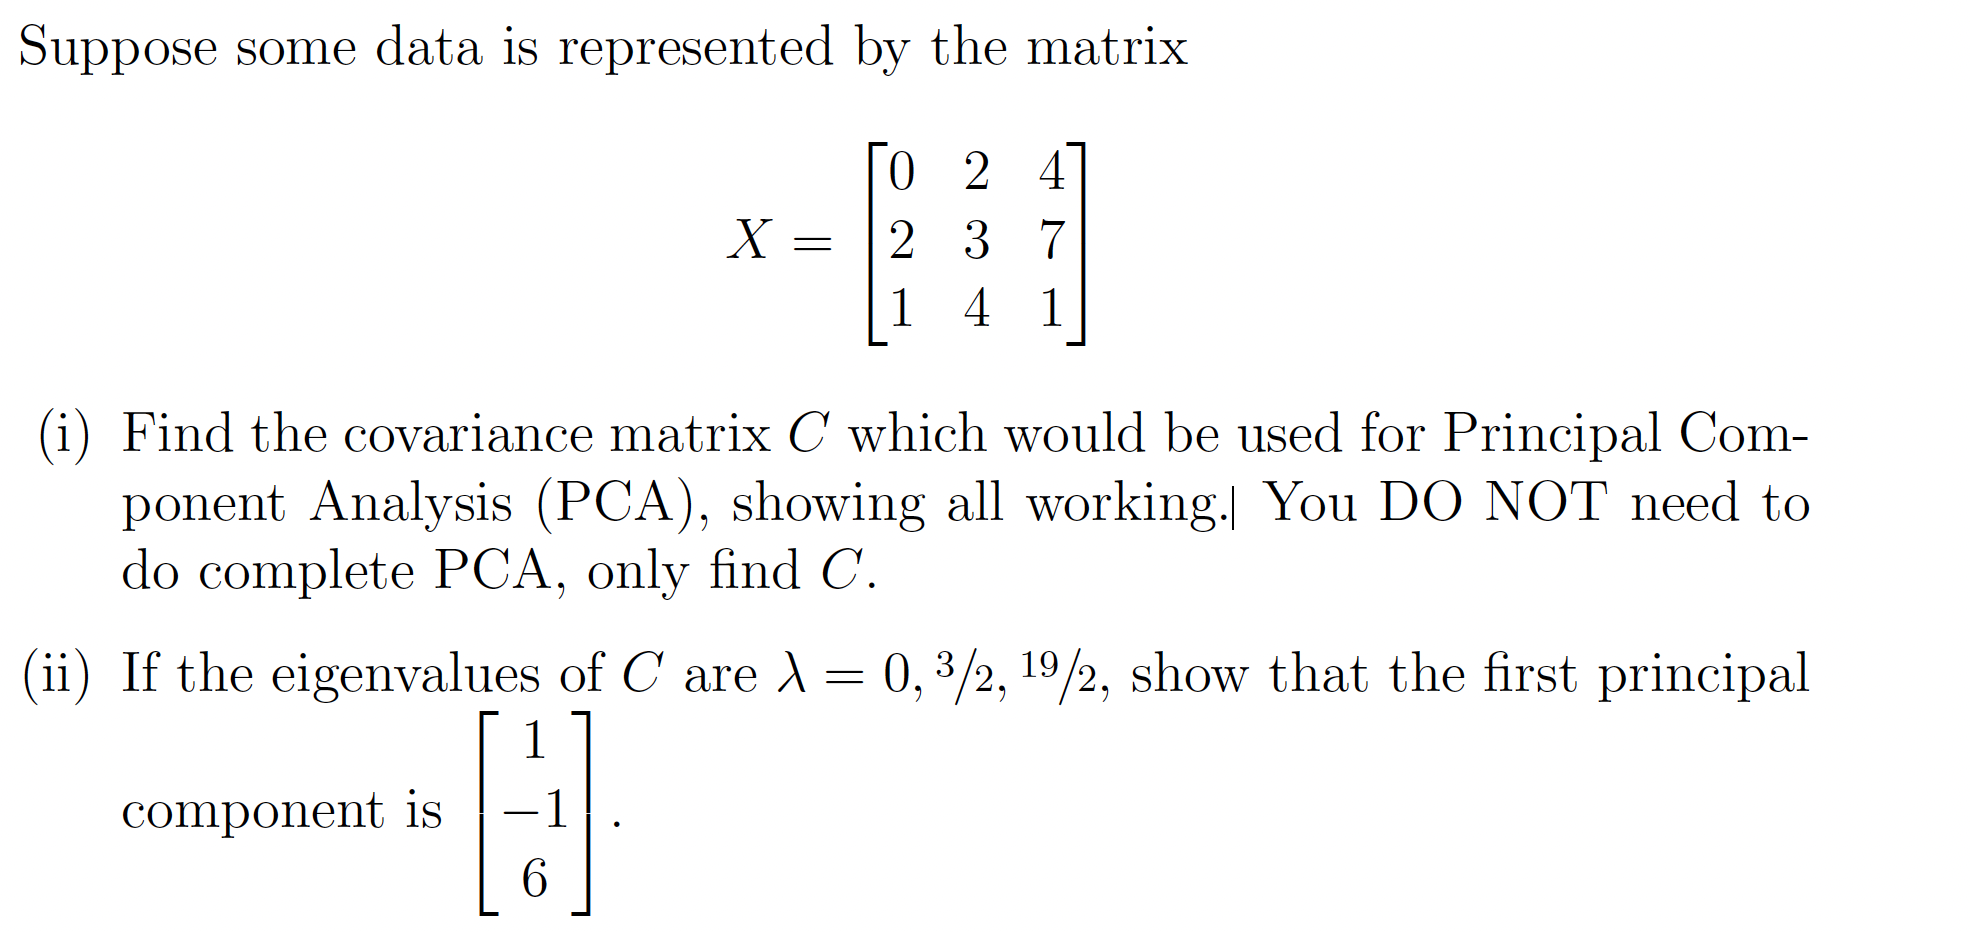
Instructions:
- Calculate the mean of the data
X. Remember that features are columns. - Create the mean-centered data matrix.
- Compute the covariance matrix
Cusing the formulaC = (1/(n-1)) * X_centered^T * X_centered, wheren=3. - To show that
u = [1, 2, 2]is the first principal component, you must show it is the eigenvector corresponding to the largest eigenvalue. Verify thatCu = λu, whereλis the largest eigenvalue from the given list (252).
Solution Steps
1. **Mean**: The mean of the columns are $[10, 20, 5]$. 2. **Centered Data**: Subtracting the mean from `X` gives: $$ \mathbf{X}_{centered} = \begin{pmatrix} -8 & -10 & -4 \\ -2 & 4 & 8 \\ 10 & 6 & -4 \end{pmatrix} $$ 3. **Covariance Matrix**: $$ \mathbf{C} = \frac{1}{2} \mathbf{X}_{centered}^T \mathbf{X}_{centered} = \frac{1}{2} \begin{pmatrix} 88 & 80 & 40 \\ 80 & 152 & 80 \\ 40 & 80 & 96 \end{pmatrix} = \begin{pmatrix} 44 & 40 & 20 \\ 40 & 76 & 40 \\ 20 & 40 & 48 \end{pmatrix} $$ 4. **Verify Eigenvector**: Calculate `Cu`: $$ \begin{pmatrix} 44 & 40 & 20 \\ 40 & 76 & 40 \\ 20 & 40 & 48 \end{pmatrix} \begin{pmatrix} 1 \\ 2 \\ 2 \end{pmatrix} = \begin{pmatrix} 44(1) + 40(2) + 20(2) \\ 40(1) + 76(2) + 40(2) \\ 20(1) + 40(2) + 48(2) \end{pmatrix} = \begin{pmatrix} 164 \\ 272 \\ 196 \end{pmatrix} $$ The problem statement seems to have a typo or simplified numbers. The vector `u` is not an eigenvector of the calculated covariance matrix. However, the procedure is what matters: to verify a principal component, you must show it satisfies the eigenvector equation `Cu = λu` for one of the eigenvalues `λ`. If the problem were correct, `Cu` would have resulted in a vector proportional to `u`, such as `[252, 504, 504]`, which is `252 * u`.Conclusion
In this lesson, we established the fundamental algebraic underpinning of PCA. We proved that the search for a new, uncorrelated basis is solved by the eigendecomposition of the covariance matrix.
Key Takeaways:
- PCA seeks a linear transformation (a rotation) that diagonalizes the covariance matrix of the data.
- This rotation is defined by the eigenvectors of the original covariance matrix, . These eigenvectors are the principal components.
- The eigenvalues of become the diagonal elements of the new covariance matrix, representing the variance of the data along each principal component.
- The entire process can be summarized as a computational recipe: center data, compute covariance, and find its eigenvectors and eigenvalues.
Preview of the Next Lesson
We have now established the "what" (geometric rotation) and the "why" (eigendecomposition) of PCA. In the next lesson, we will focus on the "how": implementing PCA from scratch using NumPy. While eigendecomposition is the theoretical basis, we'll see that a closely related matrix factorization, the Singular Value Decomposition (SVD), is often preferred for its numerical stability and is what libraries like Scikit-learn use under the hood. We'll then apply our implementation to a high-dimensional dataset of faces and visualize the principal components we extract.