Introduction
Welcome to the first lesson of our module on the Foundations of Statistical Inference.
In our previous project, you successfully simulated the Law of Large Numbers and the Central Limit Theorem. A key element of those simulations was that we started by knowing the true population parameters—for example, we knew the true mean of a die roll was 3.5. We then observed how statistics calculated from samples (like the sample mean) behaved in relation to these known truths.
In the real world, this is a luxury we don't have. We can't poll every voter or test every single battery off the production line. We only have a sample, a small slice of the world we're interested in. The entire goal of statistical inference is to use this limited sample to make educated guesses about the entire population.
To begin this journey, we must first be crystal clear about what it is we are trying to know, and what it is we actually have. This lesson is dedicated to achieving that clarity by addressing a fundamental concept: distinguishing between population parameters and sample statistics. This distinction is the bedrock upon which all of statistical estimation and hypothesis testing is built.
The Core Problem: From Sample to Population
Statistical inference addresses the problem of learning about the characteristics of a large group (the population) by studying a small, representative subset (the sample). Let's formalize these ideas.
To start, let's get a crisp, formal definition of the problem.
Lecture Notes for Math 448 Statistics
These lecture notes, 'Lecture Notes for Math 448 Statistics', provide a concise and mathematically rigorous introduction to the problem of statistical estimation. This will give you the formal framework we'll use throughout the course.
Please read Section 1.1, 'Basic problem of statistical estimation' (page 4). Focus on how it frames the core task: we have a sequence of random variables (the sample) drawn from a distribution with an unknown parameter, θ, and our goal is to gain information about θ.
As the notes highlight, we are moving from a world where parameters are known to one where they are the unknown quantities we wish to find.
Population and Parameters
- A population is the complete set of all individuals, items, or data points you are interested in studying. It can be finite (e.g., all 1,200 students in a specific school) or conceptually infinite (e.g., all possible outcomes of a coin toss).
- A parameter is a numerical value that describes a characteristic of the population. It is a single, fixed number, but its value is typically unknown to us.
We use Greek letters to denote parameters. Common examples include:
- Population Mean (): The true average of the entire population.
- Population Variance (): The true variance of the entire population, measuring its spread.
- Population Proportion ( or ): The true proportion of the population that has a certain characteristic.
For instance, in your work as an R&D engineer, the true average lifespan of every EV battery your company could ever produce is a population parameter (). It's a fixed number, but you can never know it exactly because you can't test every battery.

Sample and Statistics
- A sample is a subset of individuals, items, or data points selected from the population.
- A statistic is any numerical value calculated from a sample. Because a different sample would likely yield a different value, a statistic is a random variable. Its value is known to us, as we calculate it directly from our data.
We typically use Roman letters for statistics.
- Sample Mean (): The average of the observations in our sample.
- Sample Variance (): The variance of our sample data.
- Sample Proportion (): The proportion of our sample that has a certain characteristic.
A statistic that is used to guess the value of an unknown parameter is called an estimator. Let's watch a short video that introduces this concept very clearly.
What is an unbiased estimator? Proof sample mean is unbiased and why we divide by n-1 for sample var
This video from the Stats4Everyone channel begins by perfectly illustrating the relationship between a population, its unknown parameters, and the sample statistics we use to estimate them.
Watch the first 2 minutes and 37 seconds (0:00 - 2:37). The video clearly explains that we use a calculation from the sample (an estimator, which is a statistic) to learn something about an unknown population parameter.
The Central Idea: Using Statistics to Estimate Parameters
The fundamental goal of statistical inference is to use a sample statistic to make an intelligent guess about an unknown population parameter.
- We use the sample mean, , to estimate the population mean, .
- We use the sample proportion, , to estimate the population proportion, .
- We use the sample variance, , to estimate the population variance, .
This table provides a concise summary of the notation.
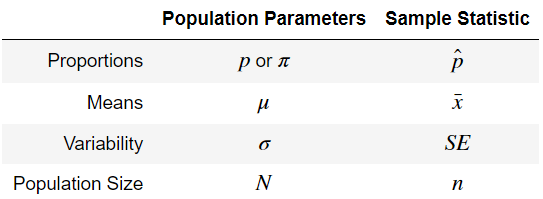
A Point of Nuance: The Sample Variance
You may have noticed something peculiar about the formula for sample variance. When calculating the variance of a full population, we divide the sum of squared deviations by the population size, .
However, when we calculate the sample variance as an estimator for , we divide by , not .
Why this difference? The reason is subtle but crucial. It turns out that if we divided by , our sample variance would, on average, slightly underestimate the true population variance . Dividing by corrects for this tendency, making a "better" guess. We will prove this mathematically in the next lesson when we discuss the concept of bias.
For now, this distinction is a perfect practical example of the difference between simply describing a sample and using a sample to infer something about a population.
Self-Assessment
To solidify your understanding, consider the following scenarios. For each one, identify the population, the sample, the parameter of interest, and the corresponding statistic.
- Manufacturing Quality Control: You want to know the true average tensile strength of a large batch of 10,000 steel rods. You randomly select 50 rods, test them, and calculate their average tensile strength.
- Population:
- Sample:
- Parameter:
- Statistic:
Answer
- Population: The entire batch of 10,000 steel rods.
- Sample: The 50 randomly selected rods that were tested.
- Parameter: $\mu$, the true average tensile strength of all 10,000 rods.
- Statistic: $\bar{x}$, the average tensile strength of the 50 tested rods.
- Election Polling: A news organization wants to gauge public opinion on a ballot measure. They want to know the proportion of all registered voters in a state who support it. They call 1,200 registered voters and ask for their opinion.
- Population:
- Sample:
- Parameter:
- Statistic:
Answer
- Population: All registered voters in the state.
- Sample: The 1,200 voters who were polled.
- Parameter: $p$, the true proportion of all registered voters who support the measure.
- Statistic: $\hat{p}$, the proportion of the 1,200 polled voters who support the measure.
- Experimental Physics: A physicist is trying to determine a fundamental physical constant. Each measurement she takes is subject to random error. She takes 200 independent measurements and wants to describe the variability of her measurement apparatus.
- Population:
- Sample:
- Parameter:
- Statistic:
Answer
- Population: The hypothetical, infinite set of all possible measurements that could be taken with her apparatus.
- Sample: The 200 specific measurements she recorded.
- Parameter: $\sigma^2$, the true variance of the measurement process.
- Statistic: $s^2$, the sample variance calculated from her 200 measurements.
Conclusion
In this lesson, we established the fundamental vocabulary of statistical inference. This conceptual clarity is essential for everything that follows.
Key Takeaways:
- Population Parameter: A fixed, unknown numerical characteristic of an entire population (e.g., , ). Our goal is to estimate this.
- Sample Statistic: A known numerical value calculated from a sample (e.g., , ). It is our tool for estimation.
- Randomness: A statistic is a random variable because its value depends on the specific random sample drawn. A parameter is a constant.
- Inference: The core idea is to use the known value of a statistic to make an educated guess about the unknown value of a parameter.
Preview of the Next Lesson:
We have established that we use statistics to estimate parameters. This naturally leads to the next question: what makes a statistic a good estimator? Just because we can calculate , for example, how do we know it's a reasonable guess for ?
In the next lesson, we will begin to answer this by formalizing the properties of estimators. We will define and mathematically formulate three key characteristics: bias, variance, and consistency. These will give us a framework for evaluating and comparing different estimators.