Introduction
Welcome to the next lesson in our journey through data science. In our previous session, we used matrix calculus to derive the Normal Equations, which give us a closed-form solution for the coefficients of an Ordinary Least Squares (OLS) model. We framed OLS as an optimization problem: finding the coefficients that minimize the sum of squared errors between the observed data and the model's predictions .
Today, we will revisit the same problem from a completely different and, for many, more intuitive angle: geometry. This lesson directly addresses your request for geometric interpretations. We will see that the algebraic solution we derived is equivalent to performing an orthogonal projection. The vector of observations lives in an -dimensional space, but the set of all possible predictions is constrained to a smaller subspace. The OLS solution is simply the projection of onto this subspace.
Your background in mechanical engineering and physics, where vector projections are used to resolve forces, will provide a strong foundation for grasping these concepts. Our goal is to explain why the Normal Equations are named as such—it all comes down to a "normal," or orthogonal, vector.
1. From Lines to Subspaces: The Geometry of Projection
Before we tackle the full OLS problem, let's build our geometric intuition by understanding how to project a vector onto a line, and then onto a plane (or a more general subspace). The key idea is that the shortest distance from a point to a subspace is always along the perpendicular.
The following video provides an excellent, step-by-step development of this idea. It begins with the simple projection of one vector onto another and builds up to the general formula for projecting onto a subspace spanned by a set of basis vectors.
Orthogonal Projection Formulas (Least Squares) - Projection, Part 2
This video, by Sam Levey, will guide us from the basic concept of projecting a vector onto a line to the general case of projecting onto a higher-dimensional subspace. It culminates by directly connecting this geometric framework to linear regression.
Please watch the following segments: Projection onto a Line (01:31 - 04:20): Focus on how the orthogonality of the 'rejection' vector (the error) is used to find the projection. Projection onto a Plane (Orthonormal Basis) (09:14 - 12:45): See how the projection onto a plane is just the sum of projections onto its orthogonal basis vectors. Projection onto a Plane (General Case) (17:07 - 20:39): This is the most important part. Pay close attention to how a system of linear equations is formed and solved to find the projection components, leading to the formula for the projection matrix. Application to Linear Regression (20:39 - 25:10): This segment ties everything together, framing linear regression as projecting the outcome vector y onto the plane spanned by the predictor vectors.
The video demonstrates that finding the projection of a vector onto the subspace spanned by the columns of a matrix involves finding the point in that subspace such that the error vector is orthogonal to the subspace.
2. The Best Approximation Theorem
The video gave us the intuition: the projection is the "closest" vector. This is a fundamental concept in linear algebra, formalized by the Best Approximation Theorem.
Let's put our OLS problem into this context:
- The vector of observations, , is a point in .
- The set of all possible predictions, , forms the column space of the design matrix , which we denote as Col(). This is a subspace of .
The OLS problem asks to find that minimizes . Geometrically, this means we are looking for the vector in Col() that is closest to .
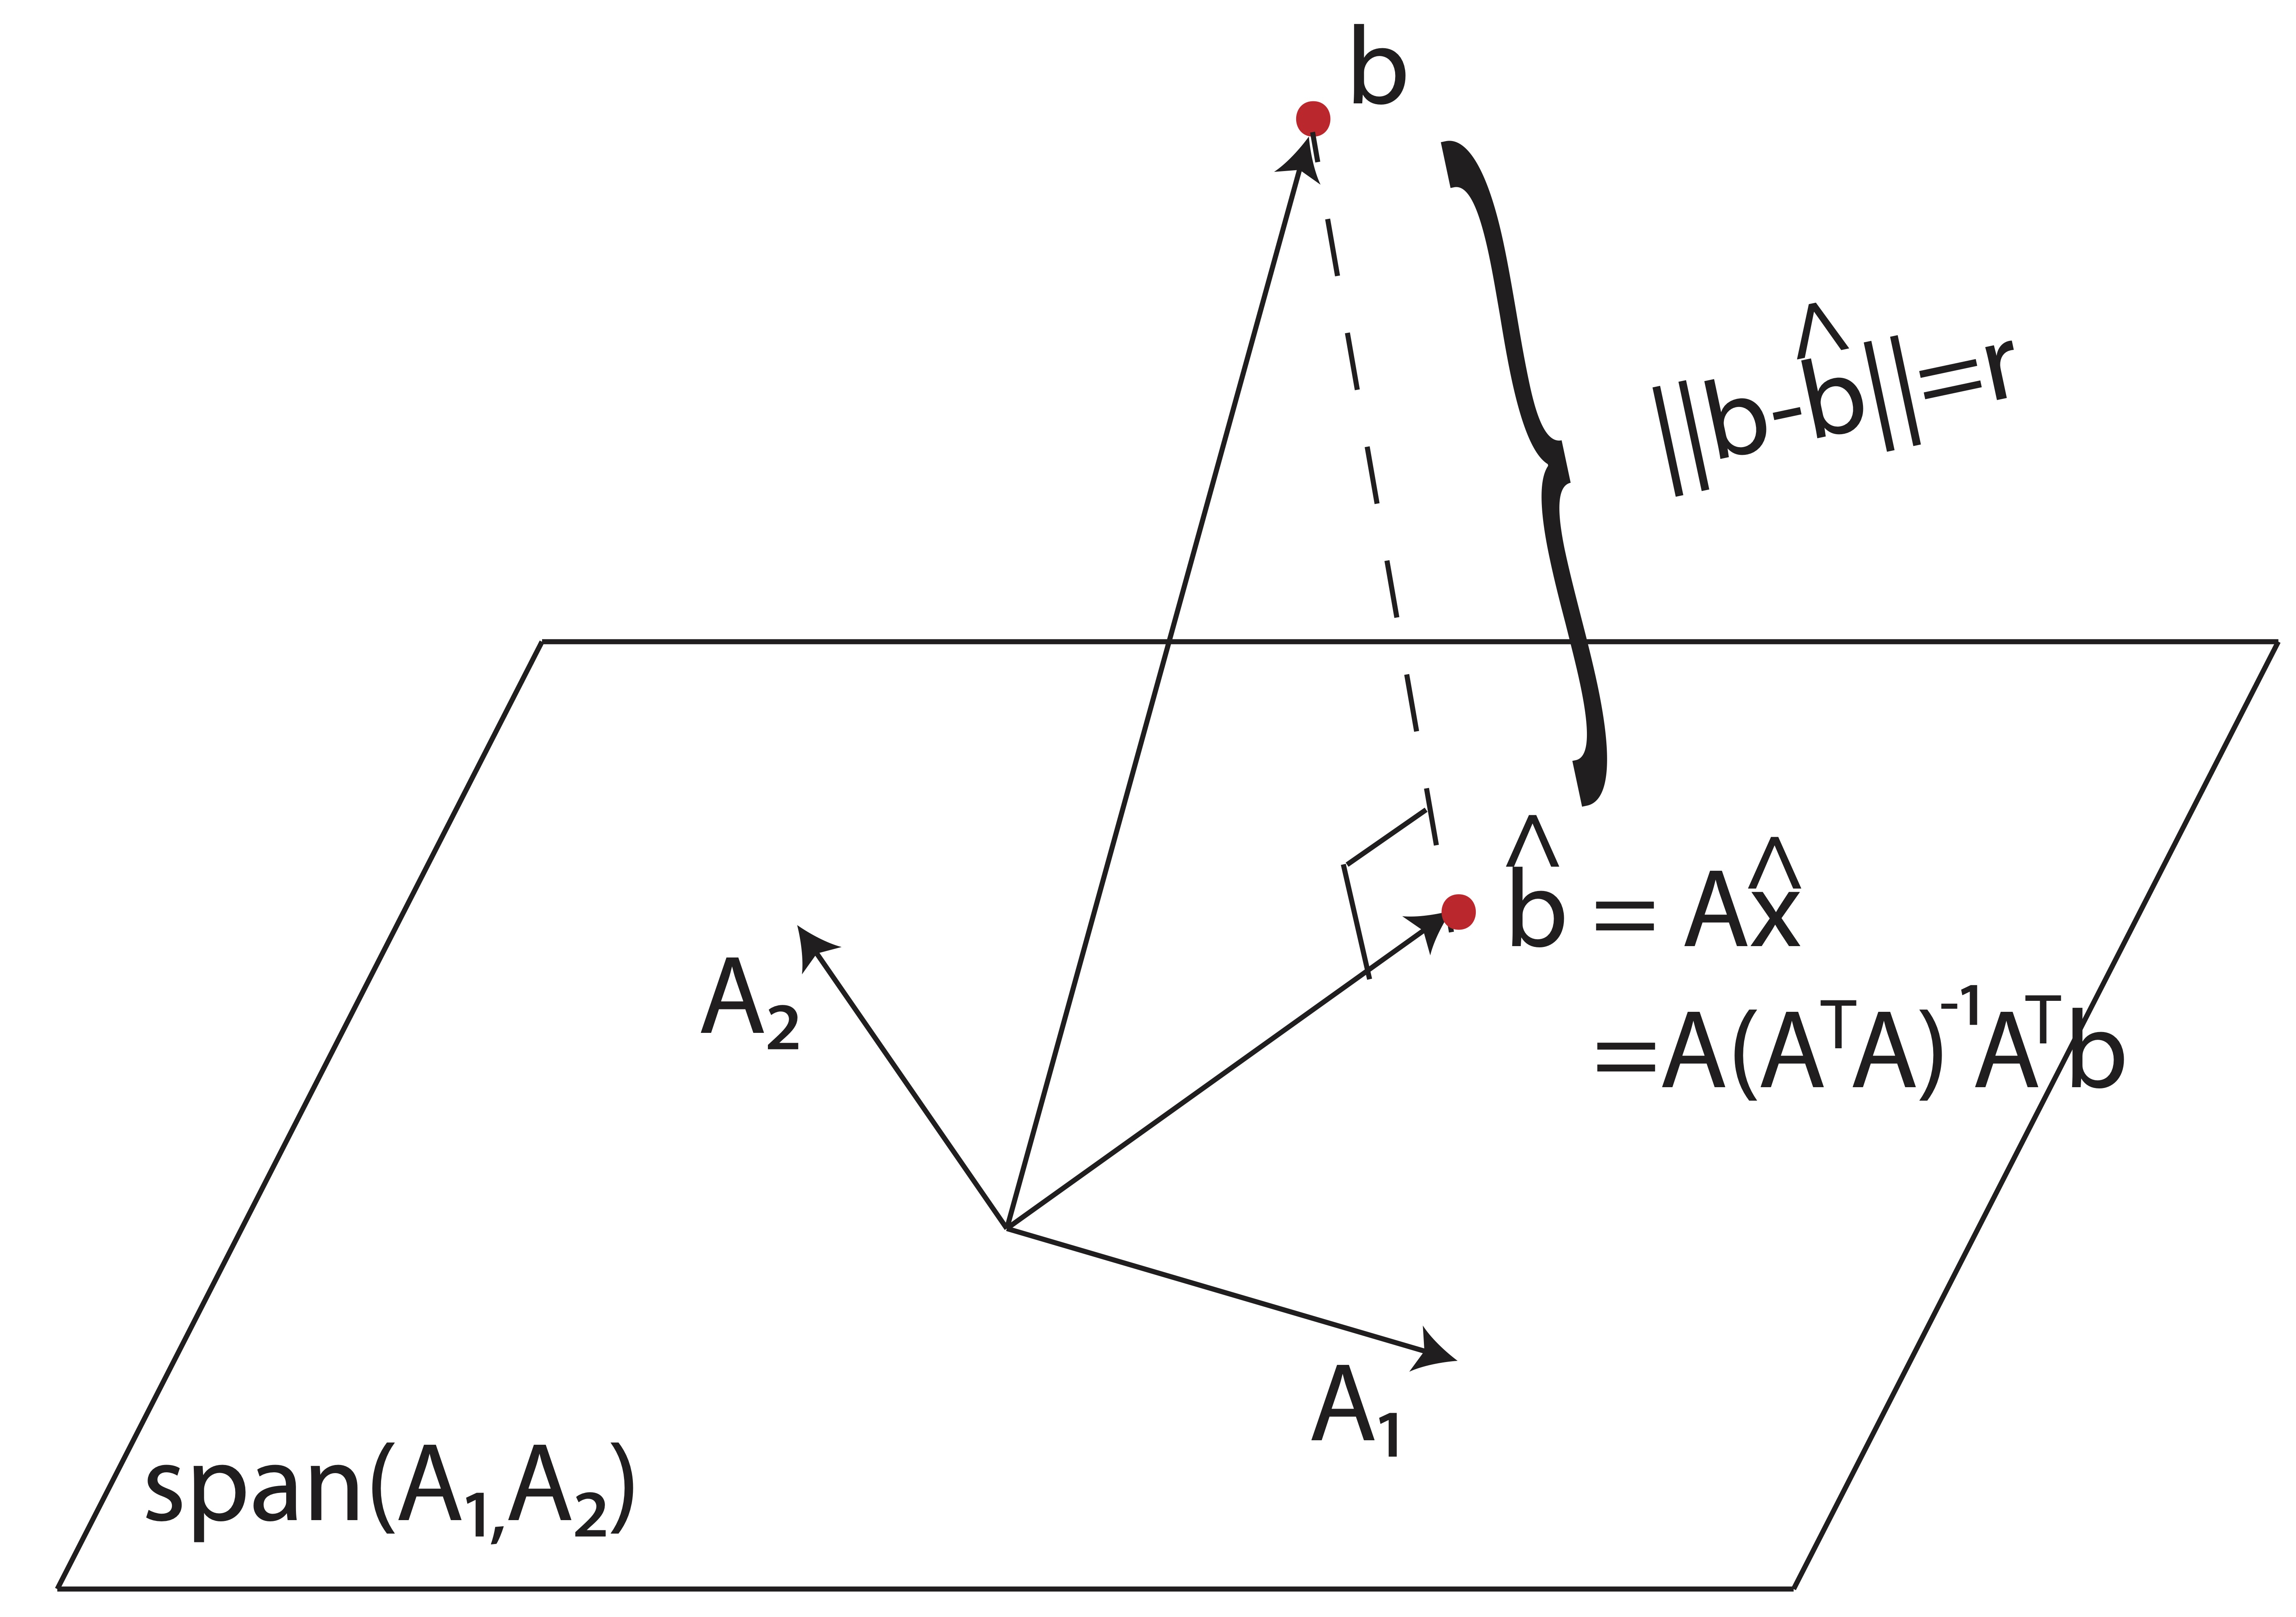
The Best Approximation Theorem guarantees that this closest vector is the orthogonal projection.
[PDF] Orthogonality and Least Squares
To formalize this crucial idea, please read the following excerpt from a linear algebra textbook. It defines the orthogonal projection and states the theorem.
Please read Section 6.3, starting from the beginning up to (but not including) Example 3 on page 351. Pay special attention to The Orthogonal Decomposition Theorem (Theorem 8) and The Best Approximation Theorem (Theorem 9). These formalize the geometric intuition we've built.
3. Deriving the Normal Equations Geometrically
Now we can connect the geometry directly to the Normal Equations we found in the last lesson.
The Best Approximation Theorem tells us that for the OLS solution , the residual vector must be orthogonal to the subspace Col().
If a vector is orthogonal to a subspace, it must be orthogonal to every vector that spans that subspace. The columns of are a spanning set for Col(). Let the columns of be . Then:
In transpose notation, this is:
We can stack all of these equations into a single matrix equation. The rows of the matrix are precisely the vectors . Therefore, the entire system of orthogonality conditions can be written as:
By distributing , we get:
Rearranging this gives us the Normal Equations:
This is the exact same result we derived using calculus, but this time, it emerges from a purely geometric argument based on orthogonality.

4. The Projection Matrix
Since the OLS prediction is the orthogonal projection of onto Col(), there must be a matrix that performs this projection. This is known as the projection matrix, often denoted (or for "hat matrix").
We know the formula for the coefficients:
And we know the predicted values are . Substituting the first equation into the second gives:
The matrix in the brackets is the projection matrix:
This matrix projects any vector onto the subspace spanned by the columns of .
A fun mathematical fact about projection matrices is that they are idempotent, meaning . This makes perfect geometric sense: if you project a vector that is already in the subspace, it should not change. Projecting a second time does nothing new.
For a worked example of how to compute and use a projection matrix, the following video is very instructive.
This MIT OpenCourseWare video shows how to compute the projection matrix for a specific plane. It presents two methods, the second of which is a clever shortcut that you might appreciate.
Watch from 00:53 to 09:52. The first part (until 05:46) shows the direct computation using the formula P = A(A^T A)^-1 A^T. The second part shows a shortcut by projecting onto the normal vector, which is a 1D subspace, and subtracting from the identity. This reinforces the relationship between a subspace and its orthogonal complement.
Conclusion
In this lesson, we explored the beautiful geometric foundation of Ordinary Least Squares, providing a powerful alternative to the calculus-based derivation from our previous session. This new perspective allows us to understand why the OLS solution takes the form it does.
Key Takeaways:
- Minimizing the sum of squared errors is geometrically equivalent to finding the vector in the column space of that is closest to the observation vector .
- The Best Approximation Theorem states that this closest vector is the orthogonal projection of onto the column space of .
- The orthogonality condition—that the residual vector is orthogonal to Col()—leads directly to the Normal Equations: .
- The OLS predictions can be obtained by applying the projection matrix to the observation vector .
Preview of the Next Lesson:
Now that we have derived the OLS estimator from two different perspectives and understand its properties, we are ready to analyze its performance. In the next lesson, we will dive into the optimality of estimators. We will state the conditions for and derive the Cramér-Rao Lower Bound (CRLB), a fundamental limit on the variance of any unbiased estimator. Then, we will prove the famous Gauss-Markov theorem, which establishes that under certain assumptions, the OLS estimator is the Best Linear Unbiased Estimator (BLUE). This will fulfill your request for these important proofs and solidify our theoretical understanding of statistical estimation.