Welcome to your second lesson in DS 215: Introduction to Data Science.
In our previous lesson, we established a strong foundation with NumPy, mastering the creation and manipulation of N-dimensional arrays. Now, we'll build directly on that knowledge to tackle the workhorse of data analysis in Python: the Pandas library.
This lesson focuses on the DataFrame, the primary data structure in Pandas for handling tabular data. Our goal is to equip you with the skills to load data from various sources, and then to systematically clean and transform it into a state that's ready for analysis and modeling. As an engineer, you know that raw data from sensors or simulations is rarely perfect. The process of data cleaning is analogous to calibrating instruments and filtering noise—it's a critical, non-negotiable step to ensure the integrity of your results.
1. From NumPy Arrays to Pandas DataFrames
While NumPy is excellent for raw numerical computation, it lacks features for handling the mixed data types, missing values, and labeled columns and rows that characterize real-world datasets. Pandas solves this by introducing two key data structures: the Series (a 1D labeled array) and the DataFrame (a 2D labeled array).
A DataFrame can be thought of as a dictionary of Series objects, where each Series represents a column. Crucially, Pandas uses NumPy arrays under the hood to store the actual data. This means you get the performance benefits of NumPy's C-based computations combined with the flexibility and intuitive labeling of Pandas.

2. Loading and Inspecting Data
The first step in any data analysis task is to load your data into a DataFrame. Pandas supports a wide variety of file formats. Once loaded, a quick inspection is essential to understand its structure and identify potential issues.
The following video tutorial provides an excellent overview of creating, loading, and inspecting DataFrames.
Complete Python Pandas Data Science Tutorial! (2025 Updated Edition)
Watch this section from Keith Galli's comprehensive Pandas tutorial. It covers the basics of what a DataFrame is and demonstrates how to load data from various file formats like CSV, Parquet, and Excel.
Watch the video from 04:03 to 13:49. Focus on: The definition and creation of a DataFrame. The primary inspection methods: head(), info(), describe(), and shape. The different ways to load data using pd.read_csv(), pd.read_parquet(), and pd.read_excel() and the brief comparison of their performance.
As you saw, the initial inspection is vital. Here's a summary of the key methods:
df.head(n): View the firstnrows.df.tail(n): View the lastnrows.df.shape: See the number of rows and columns as a(rows, cols)tuple.df.info(): Get a concise summary including the index dtype, column dtypes, non-null values, and memory usage. This is your primary tool for diagnosing data cleaning needs.df.describe(): Generate descriptive statistics for numerical columns (count, mean, std, min, max, etc.).
3. The Data Cleaning Workflow
Real-world data is often messy. Data cleaning, or "wrangling," is the process of fixing or removing errors, inconsistencies, and missing values. It's often the most time-consuming part of a data science project, but also one of the most important.
The following video provides a practical, step-by-step guide to cleaning a realistic dataset. It's an excellent template for the kind of workflow you'll use in your own projects.
Step-by-Step Data Cleaning with Python | Python Pandas Tutorial
This tutorial from Data Analytics Lab methodically walks through a complete data cleaning process on a hotel bookings dataset. It covers the most common and critical cleaning tasks.
Watch the following segments to learn a structured approach to data cleaning: Initial Inspection and Dropping/Renaming Columns (00:00 - 03:58): See how to identify and handle unnecessary or poorly named columns. Handling Missing Values (03:58 - 10:41): Learn to find NaN values and apply different strategies like dropping columns, filling with placeholders, or dropping rows. Correcting Data Types (10:41 - 12:51): Understand why data types matter and how to change them using .astype(). Removing Duplicates (21:50 - 24:30): Learn how to find and remove fully duplicated rows. Cleaning String Data (19:58 - 21:50): See how to remove unwanted special characters from text columns using regular expressions.
Key Cleaning Operations Summary:
| Task | Pandas Method(s) | Notes |
|---|---|---|
| Drop Columns/Rows | df.drop() |
Use axis=1 for columns, axis=0 for rows. |
| Rename Columns | df.rename() |
Pass a dictionary mapping old names to new names. |
| Identify Nulls | df.isnull().sum() |
Quickly counts missing values in each column. |
| Handle Nulls | df.dropna(), df.fillna() |
Drop them or fill them with a constant, mean, median, etc. |
| Change Data Types | df.astype(), pd.to_datetime() |
Crucial for memory efficiency and enabling correct operations. |
| Handle Duplicates | df.duplicated(), df.drop_duplicates() |
Essential for preventing skewed analysis. |
| Clean Strings | .str.replace() |
Use with regex for powerful text cleaning. |
A common parameter you'll see in many of these methods is inplace=True. Using it modifies the DataFrame directly. The alternative is to reassign the result, like this: df = df.drop_duplicates(). Reassignment is often considered safer and more explicit.
4. Data Transformation and Feature Engineering
After cleaning, the next step is to transform your data to make it more suitable for analysis or to create new, more informative features.
Creating New Columns
You can create new columns based on existing ones through arithmetic operations, conditional logic, or by extracting information.
Complete Python Pandas Data Science Tutorial! (2025 Updated Edition)
Let's revisit Keith Galli's tutorial to see how new columns can be created. This is a fundamental part of feature engineering.
Watch the segment from 34:13 to 46:35. Pay close attention to: Creating a new column from the result of an operation on other columns. Using np.where() for conditional column creation. Splitting a string column (.str.split()) to create new features. Converting a column to a datetime object (pd.to_datetime()) and extracting components like the year (.dt.year).
Reshaping Data: The "Tidy Data" Principle
A core concept in data manipulation is "tidy data," which states that:
- Each variable forms a column.
- Each observation forms a row.
- Each type of observational unit forms a table.
Sometimes, data is stored in a "wide" format, where columns represent values instead of variables (e.g., columns named wk1, wk2, etc.). To make it tidy, we need to reshape it into a "long" format.
- Melting (Wide to Long):
pd.melt()is used to unpivot a DataFrame from a wide to a long format. - Pivoting (Long to Wide):
df.pivot_table()is the inverse operation, used to transform data from a long to a wide format.
Python Data Analysis - Pandas for Everyone
The textbook 'Python Data Analysis' provides an excellent explanation of these reshaping operations. We'll read the relevant sections on tidying data.
Read the following sections from Chapter 6, 'Tidy Data': Section 6.2, 'Columns Contain Values, Not Variables' (pp. 124-127): This explains the concept and demonstrates pd.melt() with clear examples. Section 6.4, 'Variables in Both Rows and Columns' (pp. 133-134): This section shows how to use .pivot_table() to tidy data where variables are stored in rows.
Scaling Features: Normalization and Standardization
Many machine learning algorithms perform better when numerical input variables are scaled to a standard range. The two most common techniques are:
- Normalization (Min-Max Scaling): Rescales the data to a fixed range, usually [0, 1]. The formula is:
- Standardization (Z-score Normalization): Rescales the data to have a mean () of 0 and a standard deviation () of 1. The formula is:
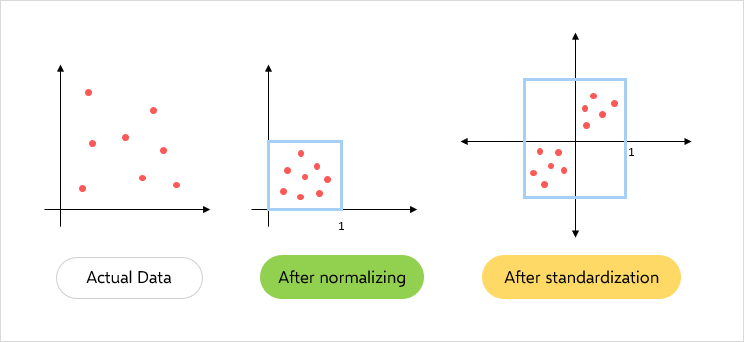
While you can implement these manually using NumPy and Pandas, the scikit-learn library provides convenient tools for this, which we will explore later in the course.
Self-Test and Practice
To solidify your understanding, let's work through a few exercises. These will challenge you to apply the cleaning and transformation techniques we've covered.
For these exercises, use the "hotel bookings" dataset from the Data Analytics Lab video. You can find a link to the dataset on Kaggle through the video's description.
-
Load and Initial Inspection:
- Load the dataset into a Pandas DataFrame.
- Use
.info()to identify columns with a significant number of missing values.
-
Cleaning:
- The
companycolumn has over 90% missing values. Drop this column entirely. - For the
agentcolumn, fill the missing values with0. - There are a few missing values in the
countrycolumn. Drop the rows wherecountryis missing. - Verify that there are no more missing values in your DataFrame.
- The
-
Transformation:
- Create a new column called
total_gueststhat is the sum ofadults,children, andbabies. - Some bookings have
total_guestsequal to 0. Filter your DataFrame to remove these rows. - Create a new column
is_resortwhich is a boolean (True/False) indicating if thehotelcolumn is 'Resort Hotel'.
- Create a new column called
-
Putting it Together:
- After all the cleaning and transformation, what is the average
lead_timefor resort hotels versus city hotels? - Hint: You can use boolean filtering (
df[df['is_resort'] == True]) and then calculate the mean.
- After all the cleaning and transformation, what is the average
For more practice, the w3resource website offers a large collection of Pandas exercises.
Pandas Exercises, Practice, Solutions
For extensive practice, this resource provides hundreds of exercises with solutions.
Navigate to the 'Pandas Handling Missing Data and Cleaning' section and try some of the exercises to sharpen your skills.
Conclusion
In this lesson, you've moved from the world of raw numerical arrays to the structured, labeled environment of Pandas DataFrames. This is a massive step forward in your ability to work with real-world data.
Key Takeaways:
- The Pandas
DataFrameis the essential tool for working with tabular data in Python. - The data analysis workflow typically follows a sequence of loading, inspecting, cleaning, and transforming.
- Cleaning involves a systematic process of handling missing values, incorrect data types, duplicates, and other inconsistencies.
- Transformation and feature engineering involve creating new, more insightful columns from existing data and reshaping your dataset into a tidy format.
You now have the two foundational libraries of the data science stack, NumPy and Pandas, under your belt. In the next lesson, we will complete our basic toolkit by learning how to visualize our cleaned and transformed data using Matplotlib, allowing us to uncover patterns and insights.