Introduction
Welcome back! In our last lesson, we delved into the subtle yet profound difference between convergence in probability and almost sure convergence, culminating in an understanding of the Strong Law of Large Numbers. As we concluded, I mentioned that our next step would be to prove a cornerstone property of one of the most important distributions in all of science and engineering: the Gaussian (or Normal) distribution.
Today, we will deliver on that promise. Our learning objective is to prove that a linear combination of independent Gaussian random variables is also Gaussian. This property, sometimes called the "stability" of the Gaussian distribution under addition, is not just a mathematical curiosity. It's the reason why Gaussian models are so prevalent. For instance, in your work with EVs, measurement noise from multiple independent sensors, each approximated as Gaussian, can be combined, and the total noise will still be Gaussian, which is a tremendously useful simplification for filtering and state estimation algorithms like the Kalman filter.
We will tackle this proof from several angles, just as you appreciate—starting with an elegant algebraic proof using transform methods, and then exploring a beautiful geometric argument.
1. The Power of Transforms: A Quick Review
In our study of the Central Limit Theorem, we introduced the characteristic function (CF), , as a powerful analytical tool. Its most crucial property for our purposes is how it behaves with sums of independent random variables.
Let's watch a brief video to refresh our memory on this key property.
What is the Characteristic Function of a Random Variable?
This video from 'Iain Explains Signals, Systems, and Digital Comms' clearly shows why the characteristic function of a sum of independent random variables is the product of their individual characteristic functions.
Watch the segment from 02:21 to 04:12. The key takeaway is that for independent X and Y, the CF of Z = X + Y is simply the product of the CFs of X and Y. This transforms the difficult problem of convolution of PDFs into a simple multiplication.
This multiplicative property is the engine of our first proof. A close relative of the characteristic function is the moment-generating function (MGF), defined as . It shares the same multiplicative property for independent variables, , and is often simpler to work with as it avoids complex numbers.
For a Gaussian random variable , the MGF is:
The corresponding characteristic function is . Notice the similar structure.
The final piece we need is the uniqueness property: If two random variables have the same MGF (or CF) in a region around , they must have the same probability distribution. Our strategy is simple: find the MGF of a linear combination of Gaussians and see if it matches the MGF of another Gaussian.
2. The Proof via Moment-Generating Functions
Let's prove the main result. Suppose we have independent random variables, for . We want to find the distribution of their linear combination:
where are constants.
We will find the MGF of , .
-
Definition of MGF:
-
Properties of Exponentials:
-
Independence: Because the are independent, the random variables are also independent. The expectation of a product of independent variables is the product of their expectations.
-
Relating to the MGF of : The term inside the product is the MGF of evaluated at the point .
-
Substituting the Gaussian MGF: We know . Substituting :
-
Putting It All Together:
When we multiply exponentials, we add their arguments: -
Conclusion: Look closely at this final form. It is the MGF of a Gaussian random variable with:
- Mean:
- Variance:
By the uniqueness property of MGFs, we have proven that must be a Gaussian random variable with this mean and variance.
The following resource provides an excellent and concise summary of this proof strategy.
Linear combinations of normal random variables
The resource 'StatLect' provides a very clear, step-by-step derivation for linear combinations of normal random variables using moment generating functions. It formalizes the steps we just walked through.
Please read the sections 'Linear transformation of a multivariate normal random vector', 'Example 1 - Sum of two independent normal random variables', and 'Example 3 - Linear combinations of mutually independent normal random variables'. Notice how the general principle of linear transformation is applied to the specific cases of sums and linear combinations.
3. Alternative Perspectives and Intuition
While the MGF proof is clean and powerful, it can feel abstract. Let's explore other ways to understand this fundamental property.
The Geometric Argument
This approach provides a beautiful intuition, especially for the sum of two independent standard normal variables, .
The joint PDF of and is:
The key insight is that the term represents the squared distance from the origin in the -plane. This means the joint PDF is radially symmetric; its value only depends on the distance from the origin, not the angle. The contours of this 3D bell-shaped surface are circles.
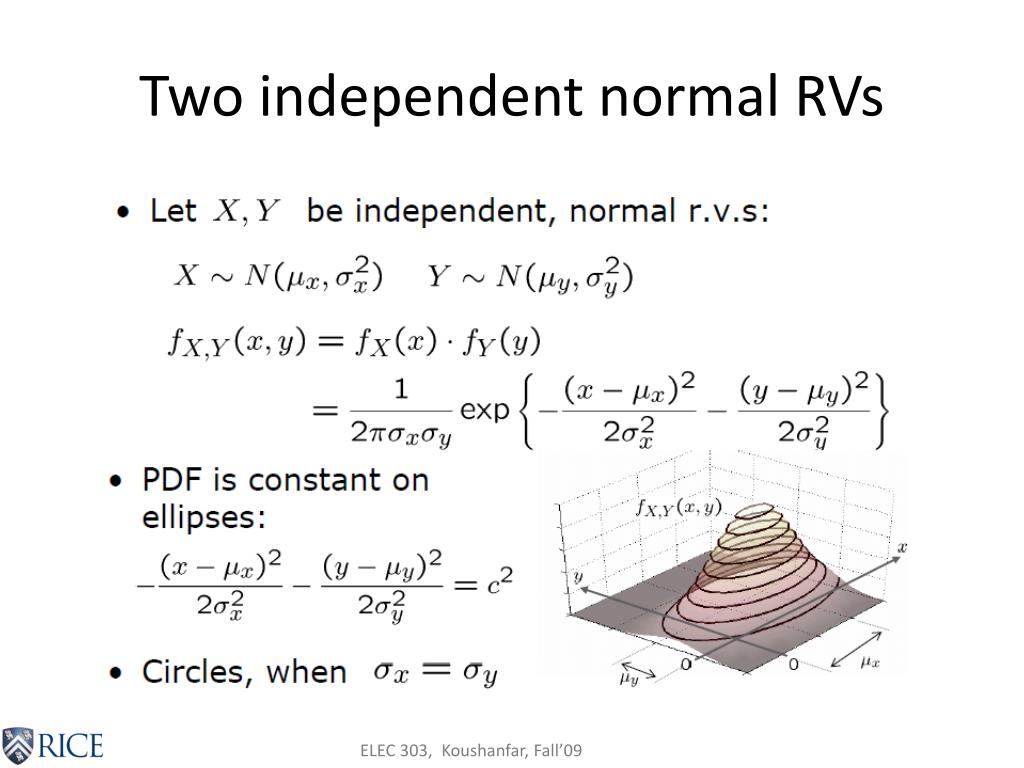
To find the distribution of , we would normally integrate the joint PDF over the region where . However, because of the radial symmetry, we can rotate the coordinate system without changing the PDF's value at any point. Let's rotate the axes so the line becomes a simple vertical line in the new coordinate system, .
The distance of this line from the origin can be found using simple geometry. The closest point on the line to the origin is , so the distance is .
After rotation, the integral for the CDF of becomes trivial, as we are integrating a standard 2D Gaussian over the half-plane . This simplifies to a 1D integral of a standard Gaussian, whose result is , where is the CDF of a variable. This is exactly the CDF of a variable. Thus, . This argument can be extended to general linear combinations.
The Convolution Proof
Another direct method is to use the formula for the distribution of a sum of independent random variables: the convolution of their PDFs.
Plugging in the Gaussian PDFs for and leads to a large integral. The trick to solving it is to combine the exponents and "complete the square" for the variable of integration, . This is algebraically intensive but demonstrates the result from first principles in the probability space, rather than the transform space.
The Wikipedia article on this topic provides detailed proofs for all three methods we've discussed.
Sum of normally distributed random variables
This Wikipedia article provides a comprehensive overview, including proofs using characteristic functions (very similar to our MGF proof), convolutions, and the geometric argument we just discussed.
Skim the 'Proof using characteristic functions' to see its similarity to the MGF proof. Then, carefully read the 'Geometric proof' section, as it offers a powerful intuitive understanding. You can also look at the 'Proof using convolutions' to appreciate the algebraic steps involved, even if you don't follow every line.
4. A Quick Simulation
Let's verify this property computationally. We can simulate it in Python using NumPy. Let's take two independent Gaussians, and , and form the linear combination .
According to our theorem:
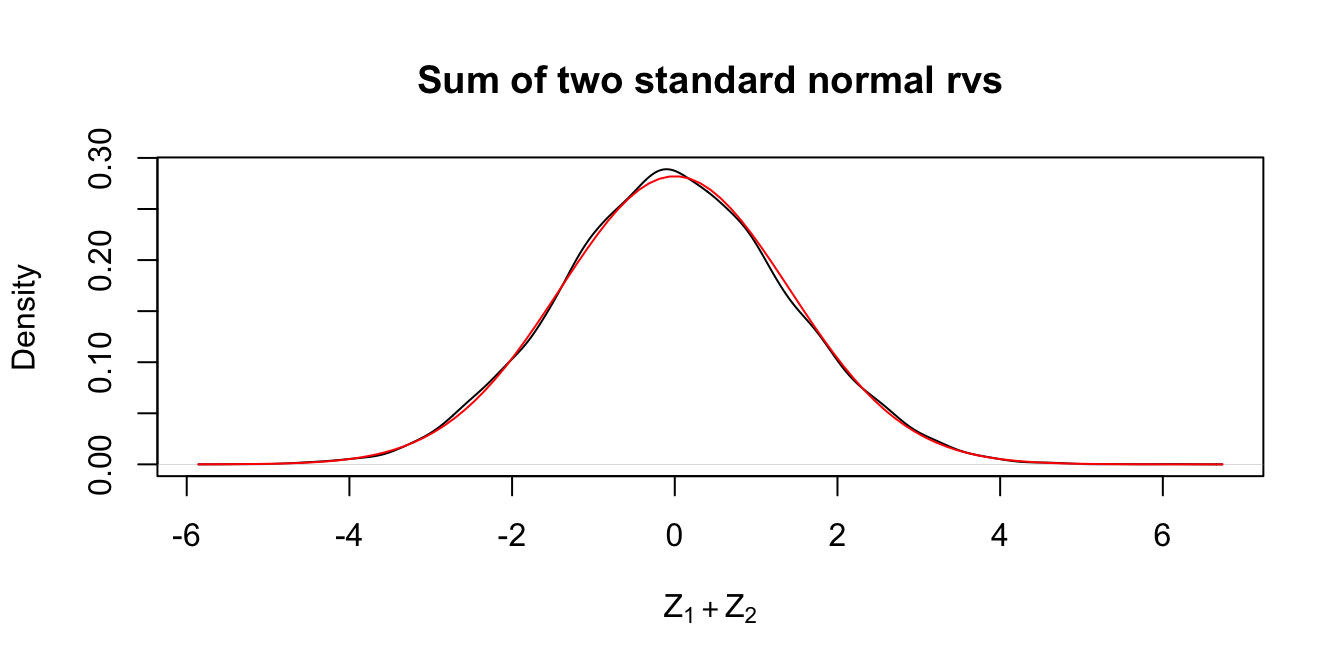
So we expect .
Here is the code to test this:
import numpy as np
import matplotlib.pyplot as plt
from scipy.stats import norm


# Parameters
mu1, sigma1 = 10, 2
mu2, sigma2 = 5, 3
a1, a2 = 0.5, 2
n_samples = 100000


# Generate samples
X1 = np.random.normal(mu1, sigma1, n_samples)
X2 = np.random.normal(mu2, sigma2, n_samples)


# Create the linear combination
Y = a1 * X1 + a2 * X2


# Theoretical parameters for Y
mu_Y = a1 * mu1 + a2 * mu2
sigma_Y_sq = a1**2 * sigma1**2 + a2**2 * sigma2**2
sigma_Y = np.sqrt(sigma_Y_sq)


# Plotting
plt.figure(figsize=(10, 6))
plt.hist(Y, bins=100, density=True, label='Simulated Data (Y)')


# Overlay the theoretical PDF
x_range = np.linspace(mu_Y - 4*sigma_Y, mu_Y + 4*sigma_Y, 200)
plt.plot(x_range, norm.pdf(x_range, mu_Y, sigma_Y), 'r-', linewidth=2, label='Theoretical PDF')
plt.title('Distribution of a Linear Combination of Gaussians')
plt.xlabel('Value')
plt.ylabel('Density')
plt.legend()
plt.grid(True)
plt.show()

print(f"Theoretical Mean: {mu_Y:.2f}, Sample Mean: {np.mean(Y):.2f}")
print(f"Theoretical Variance: {sigma_Y_sq:.2f}, Sample Variance: {np.var(Y):.2f}")
When you run this code, you'll see that the histogram of the simulated data aligns perfectly with the red line representing the theoretical Gaussian PDF, and the sample statistics will be very close to their theoretical values.
Conclusion
In this lesson, we established a critical property of the Gaussian distribution. This wasn't just an exercise in proof techniques; it was about understanding why the Gaussian distribution is so ubiquitous and analytically convenient.
Key Takeaways:
- A linear combination of independent Gaussian random variables is itself a Gaussian.
- The mean of the resulting Gaussian is the linear combination of the individual means: .
- The variance of the resulting Gaussian is a weighted sum of the individual variances, where the weights are the squares of the coefficients: .
- This property can be proven elegantly using transform methods (MGFs or CFs), which turn convolutions into simpler multiplications. Intuitive geometric arguments also exist.
Preview of the Next Lesson:
So far in this course, we have operated under the assumption that we know the parameters of our probability distributions (like and ). But in the real world, these are almost never known. We only have data, and we must use that data to make educated guesses about the underlying process that generated it.
This brings us to the next major pillar of our course: Statistical Inference. In the next module, we will begin our journey into the science of estimating unknown parameters from data. Our first lesson will lay the groundwork by clearly distinguishing between the true, unknown population parameters and the sample statistics we compute to estimate them. We will then define what makes an estimator "good."