Hello! Welcome back to our second module, Market Structure Fundamentals.
In the last lesson, we identified the Change of Character (CHoCH), the first sign that a trend might be reversing. We learned that a CHoCH breaks structure against the prevailing trend, giving us a crucial warning to stop looking for trend-following trades.
So far, we've focused on the major swing points that paint the big picture of the market. But price doesn't move in a straight line from a swing low to a swing high. There's a whole story unfolding within each of those major moves.
Today, we will learn to distinguish between internal and external market structure. External structure is the overarching trend you've been mapping, while internal structure refers to the smaller price movements within it. Understanding this difference is vital for timing your entries and knowing whether you're trading with the main trend or in a temporary pullback.
1. Defining External and Internal Structure
Let's establish our core definitions:
- External Structure (or Swing/Major Structure): This is the framework of major swing highs and swing lows that you've been using to define the overall trend. A break of external structure is the Break of Structure (BOS) you learned about, which confirms trend continuation.
- Internal Structure (or Minor Structure): This is all the smaller-scale price action that occurs within a single leg of the external structure (i.e., between a confirmed external low and high).
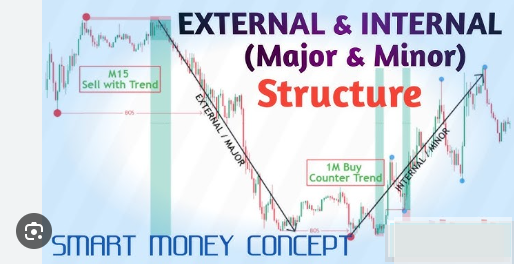
This image gives a clean, simplified look at the concept. The large swings are the "Major Structure" (External), and the smaller wiggles within them are the "Minor Structure" (Internal).

The following video provides an excellent on-chart demonstration of how to map these two different types of structure.
Master MARKET STRUCTURE in 30 Days or Less!
The video 'Master MARKET STRUCTURE in 30 Days or Less!' by TraderJones will help us visualize these concepts. First, we'll watch how he maps the main 'swing' (external) structure, which should be a good review. Then, we'll see his definition of internal structure.
Watch the following two clips: Swing Structure (01:47 - 04:30): Pay attention to how he identifies the major swing points and the break of structure (BOS) that defines the larger, external trend. This is the 'big picture' view. Internal Structure (13:01 - 14:20): Now, focus on how he defines internal structure as the price action in between the swing points. Note his key point: we use internal structure to know when the higher timeframe pullbacks are starting and ending.
As the video and the writofinance.com article "Structure Mapping in Smart Money Concept" note, this concept is rooted in the market's fractal nature. The patterns of trends and pullbacks you see on a high timeframe are composed of smaller trends and pullbacks on a lower timeframe. What is internal structure on a daily chart may be the external structure on a 15-minute chart.
2. The Purpose: Why Differentiate?
So, why do we make this distinction? Because internal and external structures tell us different things and serve different analytical purposes.
- External Structure tells us the overall directional bias. If the external structure is bullish (making higher highs and lows), our primary expectation is for price to eventually go higher.
- Internal Structure describes the current order flow within the pullback. It tells us the story of the retracement that happens after an external break of structure.
This relationship is where the power of this concept lies. A shift in internal structure is often the first clue about what the external structure will do next.
Let's connect this to what you learned about the Change of Character (CHoCH) in the last lesson.
- When external structure breaks to the upside (a bullish BOS), we anticipate a pullback. The beginning of that pullback is often signaled by a bearish CHoCH in the internal structure.
- As price pulls back into a logical area (which we'll define as Premium/Discount zones later), we wait for the pullback to end. The end of that pullback is signaled by a bullish CHoCH in the internal structure, aligning order flow back with the external trend. This is a high-probability signal that the main trend is ready to resume.
The video below explains this dynamic perfectly.
How To Identify Market Structure (Swing vs Internal vs Sub Structure)
The video 'How To Identify Market Structure' by Fantastic Mr. Forex provides a mechanical way to view this relationship. It clearly explains how shifts in internal structure signal the start and end of the larger external pullback.
Watch these two key segments: Internal Structure Flips Bearish (09:10 - 12:20): Observe how a break in the bullish internal structure (a CHoCH) is the first sign that the larger swing pullback is starting. This is where you can anticipate a counter-trend move. Internal Structure Flips Bullish (19:16 - 22:20): This is the critical part. See how the internal structure, which was bearish during the pullback, shifts back to bullish. This aligns the internal flow with the external bullish trend and presents a high-probability setup to trade the continuation of the main trend.
3. The "Why": An Introduction to Internal and External Liquidity
To fully grasp this concept from an ICT perspective, we must think about liquidity. The market moves to engineer and capture liquidity.
- External Range Liquidity: These are the large pools of orders resting above major external highs (buy-side liquidity) and below major external lows (sell-side liquidity). This is the primary target—the "real prize" for the market algorithm.
- Internal Range Liquidity: These are the smaller pools of liquidity that build up at minor swing points within the external range. This is the "low-hanging fruit."
Smart money often engineers a move to sweep internal liquidity first, luring in retail traders, before launching the real move toward external liquidity. Therefore, the external structure defines your ultimate target, while the internal structure shows you the path price is taking to get there, including the traps being set along the way.
Internal vs External Range Liquidity In ICT Trading Explained
The article 'Internal vs External Range Liquidity In ICT Trading Explained' on liquidity-provider.com connects these structural concepts to their underlying purpose. Reading this will give you the 'why' behind the price movements.
Please read the sections titled: 'What Is Internal Range Liquidity?' 'What Is External Range Liquidity?' 'Key Differences Between Internal and External Range Liquidity' Focus on how external liquidity represents the major market objective, while internal liquidity is often used for inducement and short-term moves.
4. Practical Application
Let's see this in action. The best way to understand the interplay between these two structure types is to watch a real trade example where the analysis is built layer by layer.
This image shows a clear example of how you might frame a trade. The M15 chart shows a bearish external trend ("Sell with Trend"), but within that, the 1M chart shows a bullish internal structure, which would be a counter-trend buy opportunity during the pullback phase.
Now for a detailed video walkthrough.
How To Identify Market Structure (Swing vs Internal vs Sub Structure)
We'll return to the 'How To Identify Market Structure' video by Fantastic Mr. Forex to watch his live trade example. He does an excellent job of putting all these pieces together.
Watch the extended example from 24:01 to 35:20. This is a longer clip, but it's incredibly valuable. Observe how he: Identifies the M15 external structure break to the downside, establishing a bearish bias. Anticipates a pullback. Identifies the internal structure flipping bullish (a CHoCH), signaling the start of that pullback. Finds an entry to trade this internal bullish structure (a counter-trend trade) as it moves up to facilitate the larger external pullback.
Conclusion
Great work today. You've added a crucial layer of depth to your market structure analysis. By being able to separate the main trend from the corrective moves within it, you are much better equipped to understand the market's complete narrative.
Key Takeaways:
- External (Swing) Structure defines the main trend and your overall directional bias. Its breaks (BOS) confirm trend continuation.
- Internal (Minor) Structure describes the price action within a single external leg, typically representing the pullback phase.
- A shift in internal structure (CHoCH) against the main trend signals the start of an external pullback.
- A shift in internal structure back in alignment with the main trend signals the end of that pullback and presents a high-probability trade setup.
- From a liquidity perspective, external structure points toward External Range Liquidity (the main objective), while internal price action often manipulates Internal Range Liquidity along the way.
Preview of the Next Lesson:
We've established that the external structure provides our main directional bias. But how do we decide which timeframe's external structure is most important? In the next lesson, we will focus on how to determine the directional bias from a higher timeframe's market structure. This will be the cornerstone of your daily analysis, helping you decide whether you should be looking for buying or selling opportunities.