Hello! Welcome back to our course.
In our last lesson, we learned to distinguish between external (swing) structure and internal (minor) structure. We established that the external structure defines the main trend, while the internal structure shows us the pullbacks and retracements that happen along the way. This distinction is the first step toward understanding the market's narrative.
Today, we're going to build on that foundation to tackle one of the most critical skills in ICT trading: how to determine the directional bias from a higher timeframe's market structure. This is the process of forming a strong, evidence-based hypothesis about where the price is most likely to go for the upcoming day or week. Mastering this will provide the context for every trade you consider and is the key to aligning yourself with institutional order flow.
1. The Power of the Higher Timeframe
Before we dive into the "how," let's establish the "why." Why must we start our analysis on higher timeframes like the weekly, daily, or 4-hour charts?
Simply put, higher timeframes carry more weight. A single daily candle contains all the order flow and price action of a full 24-hour session. As such, the trends and key levels on these charts represent more significant capital commitment and are more respected by the market's algorithm. By starting our analysis here, we gain a clear, powerful perspective on the market's overarching intention. This is called top-down analysis.
How to Understand Multi-Timeframe Market Structure - MUST WATCH | SMC | FOREX [Part 2]
The video 'How to Understand Multi-Timeframe Market Structure' by Matt Donlevey from Photon Trading explains this principle clearly. Let's watch a short clip on why higher timeframes are so important.
Watch the segment from 02:38 to 04:53. Pay close attention to the analogy 'Time is power.' The presenter explains that a weekly candle condenses a massive amount of information and order flow, making its structure more significant than, for example, a 1-minute candle.
This top-down approach prevents us from getting lost in the "noise" of lower timeframes and grounds our trading decisions in the most dominant market trend.
2. What is Directional Bias?
In ICT, Directional Bias (or Daily Bias) is your analytical conclusion about the market's most probable direction for a specific period. It's not a guess; it's a hypothesis based on how the market is moving between key areas of liquidity and imbalance.
Having a clear bias serves several critical functions:
- It provides a framework: It tells you whether you should be looking for buy setups or sell setups.
- It filters out noise: It helps you ignore counter-trend movements that are merely pullbacks or liquidity grabs.
- It aligns you with smart money: It positions you to trade in the same direction as the major institutional flow.
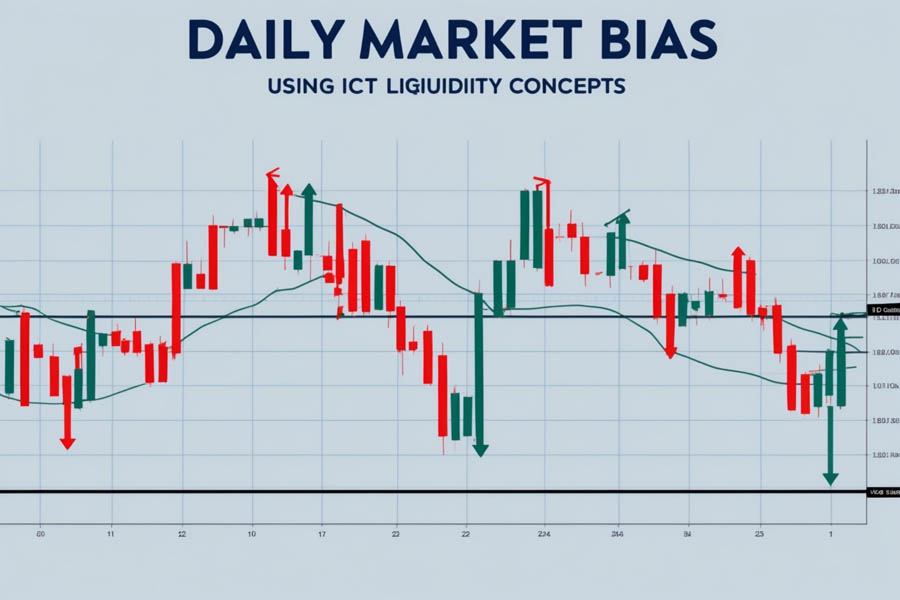
What is the Daily Bias? Identifying Market Direction in the ICT Method
The article 'What is the Daily Bias?' from TradingFinder provides a solid definition and explains its importance. It frames bias as a way to understand the market's behavioral model.
Read the introductory section 'What is the Daily Bias?' and the section 'Why is the daily directional bias important in the ICT style?'. Focus on how bias helps you view price movements not as random fluctuations, but as the execution of a liquidity-driven move.
3. How to Determine Higher Timeframe Bias
Determining bias is a systematic process of reading the story that the higher timeframes are telling. Here’s a step-by-step approach.
Step 1: Start with the Weekly and Daily Charts
Your first task is to zoom out. Look at the weekly and daily charts to identify the current external (swing) market structure.
- Is the market making a series of higher highs and higher lows? The structural bias is bullish.
- Is it making lower lows and lower highs? The structural bias is bearish.
This initial step tells you the dominant, long-term order flow.
Step 2: Identify the "Draw on Liquidity"
Once you know the structural bias, ask yourself: "Where is the price most likely going next?" This destination is called the draw on liquidity. As we discussed in the last lesson, the algorithm moves price between two types of liquidity:
- External Range Liquidity (ERL): Major swing highs (buy-side liquidity) and swing lows (sell-side liquidity).
- Internal Range Liquidity (IRL): Price inefficiencies within the range, such as Fair Value Gaps (FVGs). (We will cover FVGs in detail in a future module).
The market algorithm tends to oscillate between these two. If price has recently swept a major external high, it's likely to retrace to seek internal liquidity (like an FVG). If it has just filled an FVG, it's likely to target the next pool of external liquidity.
A simple yet effective way to start identifying the draw on liquidity is by marking the previous day's high/low and the previous week's high/low. These are natural targets for the market algorithm.
ICT Daily Bias - The Only Video You Will Ever Need!
The video 'ICT Daily Bias - The Only Video You Will Ever Need!' by TTrades gives a very practical guide on using previous day and week levels to frame a bias. Let's watch how he does it.
Watch the following two clips: Using Previous Day High/Low (00:28 - 04:56): Notice how he anticipates price reaching for the previous day's high in an uptrend, and the previous day's low in a downtrend. Also, note how a sweep of one of these levels followed by a failure to continue can signal a reversal. Using Previous Week High/Low (04:56 - 07:21): This expands the same concept to a higher timeframe, showing the fractal nature of this process.
Step 3: Analyze the Price Action at Key Levels
It's not enough to know where the key levels are. You must also analyze how price behaves when it gets there. A key concept here is displacement.
- If price breaks above a key high and closes decisively above it with strong momentum (displacement), it confirms the bullish bias. The next objective is likely a higher liquidity pool.
- If price wicks above a key high (a liquidity sweep) but then closes back below it (failure to displace), it suggests the move was a stop hunt. The bias may now be bearish, targeting the opposing liquidity pool.
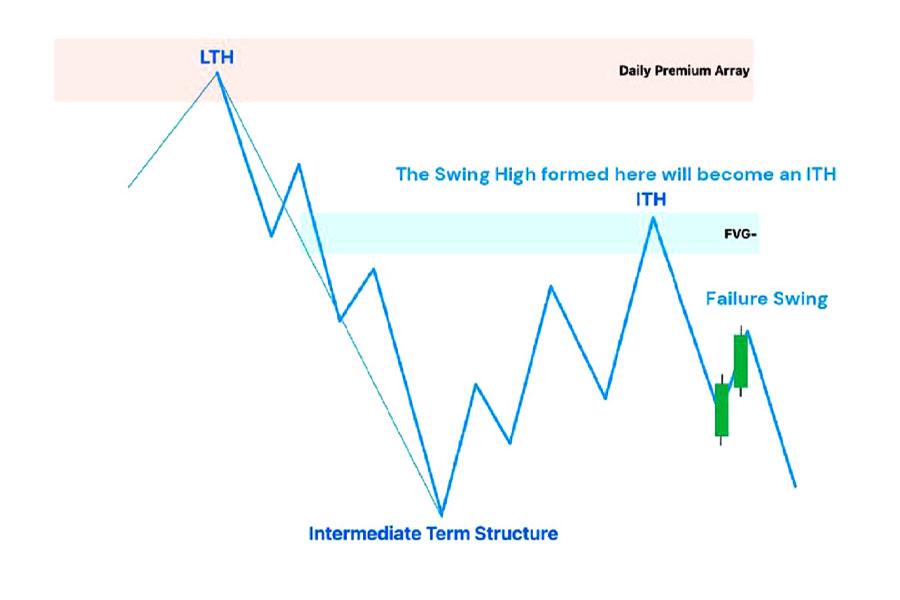
4. Structural Bias vs. Momentary Bias: Don't Get Confused
This brings us to a crucial distinction that builds directly on our last lesson. The bias you derive from the Daily and 4-Hour charts is your Structural Bias. It is stable and defines the overall path.
The price action you see on lower timeframes (like the 15-minute or 5-minute) reflects the Momentary Bias. This is the internal structure, which can be volatile as it facilitates pullbacks.
A common and costly mistake is to form your directional bias from the lower timeframes. A bullish trend on the M15 chart might just be a pullback within a larger bearish trend on the Daily chart. If your structural bias is bearish, that M15 uptrend is a counter-trend move—a low-probability area to be looking for buys and a high-probability area to start looking for sells.
What is the Daily Bias? Identifying Market Direction in the ICT Method
The TradingFinder article on Daily Bias has an excellent section that clarifies this distinction and highlights common mistakes. This is a critical read.
Please read these two sections carefully: 'Common Mistakes in Using the Daily Bias': Focus on the first point, 'Determining the Bias Based on Lower Timeframes.' 'Comparison Between Structural Bias and Intraday (Momentary) Bias': Study the table. It perfectly summarizes the difference between the stable, reliable bias from higher timeframes and the fleeting bias on lower timeframes.
Conclusion
You've now learned the cornerstone of ICT analysis: establishing a directional bias from higher timeframes. By starting with a top-down approach, you frame your entire trading day around the market's most probable path, significantly increasing your odds of success.
Key Takeaways:
- Top-Down Analysis is Non-Negotiable: Always start with the Weekly and Daily charts to understand the main story.
- Determine Structural Bias: Identify the external market structure (bullish or bearish) on the higher timeframes.
- Find the Draw on Liquidity: Formulate a hypothesis about where price is headed—to an old high/low (ERL) or an imbalance (IRL).
- Differentiate Bias Types: Your Structural Bias (from HTF) is your guide. The Momentary Bias (on LTF) is just the path, including pullbacks. Never let the Momentary Bias dictate your overall direction.
Preview of the Next Lesson:
Now that you can determine the overall direction, how do you find a safe and precise entry that aligns with it? In our next lesson, we will learn how to identify alignment between lower timeframe structure and higher timeframe bias. This is where we will learn to patiently wait for the internal structure to shift back in sync with our external bias, giving us the green light to enter a trade.