Hello! Welcome to the final lesson in our module on liquidity concepts.
In our previous lesson, you learned how to spot a liquidity sweep—a clear footprint left by institutional traders. This tells you where the market has just been. Today, we will answer the crucial next question: Where is the market likely going next?
Our learning outcome for this session is to anticipate the next likely draw on liquidity based on market structure. This is one of the most vital skills in ICT trading, as it forms the basis for establishing a directional bias—a hypothesis about whether the market is more likely to go up or down. Mastering this will elevate you from simply reacting to price action to proactively anticipating it.
1. Defining the "Draw on Liquidity" (DOL)
The "Draw on Liquidity" (DOL) is the specific pool of liquidity that the market's algorithm is currently targeting. Think of it as the market's destination. By correctly identifying the DOL, you can align your trades with the primary direction of institutional order flow.
To begin, let's get a clear definition of the DOL and the different types of liquidity it targets.
Draw on Liquidity (DOL) - ICT Concepts
The video 'Draw on Liquidity (DOL) - ICT Concepts' by TTrades provides a concise introduction. It will define the concept and distinguish between the two main types of liquidity the market seeks.
Watch the segment from 00:00 to 01:24. Focus on the definitions of Draw on Liquidity, External Liquidity, and Internal Liquidity.
As the video explained, the market seeks two primary types of liquidity:
- External Range Liquidity (ERL): This refers to the liquidity resting above old swing highs (buy-side) and below old swing lows (sell-side). This is typically where a major price trend is headed.
- Internal Range Liquidity (IRL): This includes liquidity within the current trading range, such as Fair Value Gaps (FVGs), Order Blocks, and other PD Arrays. Price often seeks internal liquidity during a retracement before continuing its move toward external liquidity.
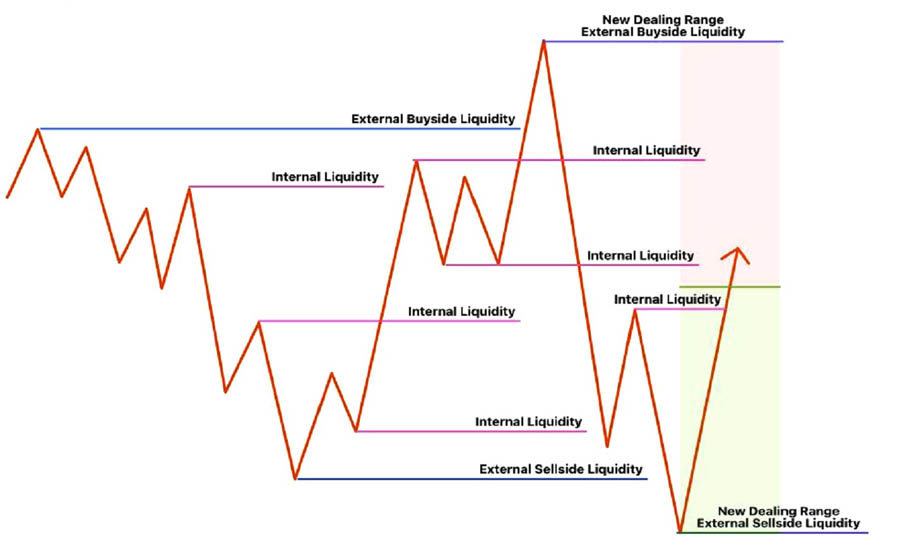
Your job as a trader is to determine whether price is currently seeking internal liquidity (suggesting a retracement) or external liquidity (suggesting a trend continuation or reversal).
2. The Primary Clue: Following Displacement and Structure
The most powerful clue to the market's intention is displacement. As we covered in Module 1, displacement is a strong, energetic, one-sided price move that leaves imbalances like Fair Value Gaps in its wake. It signifies institutional participation.
The rule is simple: Follow the displacement.
- If you see strong displacement to the upside, the draw on liquidity is likely higher.
- If you see strong displacement to the downside, the draw on liquidity is likely lower.
Let's see this principle in action.
Draw on Liquidity (DOL) - ICT Concepts
Let's return to the TTrades video. The next section provides excellent chart examples of how to follow displacement to anticipate the next price leg.
Watch from 01:24 to 05:45. Notice how after price takes a low, the presenter waits for displacement to the upside before concluding the draw is now higher. Conversely, when price fails to displace higher and moves down aggressively, the draw becomes the next lower low.
This leads to a fundamental framework:
- Price moves and takes out a liquidity pool (e.g., a swing low).
- You then watch the reaction. Does it displace aggressively away from that level (e.g., upwards)?
- If yes, the market has shown its hand. The new DOL is likely the next opposing liquidity pool (e.g., a swing high).
3. The Confirmation Tool: Respecting vs. Disrespecting PD Arrays
While displacement gives us the initial direction, we need a way to confirm our hypothesis. In ICT, the ultimate confirmation tool is observing how price interacts with PD Arrays (like Fair Value Gaps and Order Blocks).
The logic is as follows:
- If the market is truly bullish and seeking a higher DOL, it should respect bullish PD arrays (find support at them) and disrespect bearish PD arrays (break right through them).
- If the market is truly bearish and seeking a lower DOL, it should respect bearish PD arrays (find resistance at them) and disrespect bullish PD arrays.
This concept is the key to determining the DOL with confidence. Let's watch a video that is entirely focused on this technique.
How to Find the Draw on Liquidity EASILY! (DOL) - ICT Concepts
The video 'How to Find the Draw on Liquidity EASILY!' by Justin Werlein is one of the clearest explanations of this core concept. We'll break it down into a few parts.
Please watch the following segments: The Core Idea (00:00 - 01:34): The presenter introduces the central idea of using the validation and invalidation of PD arrays to determine the DOL. Bullish DOL Example (01:34 - 04:10): Pay close attention to how price breaking through a bearish Fair Value Gap signals that the draw on liquidity is now higher. Flipping the Bias (04:10 - 05:49): Observe how he uses the same logic in reverse. If price is expected to go lower but instead breaks through a bearish PD array, he immediately flips his bias to bullish.
Constantly asking yourself, "What is being respected, and what is being disrespected?" is how you will maintain an accurate read on the market's intention. When you see a bullish FVG holding as support while bearish FVGs are being ignored, you have strong confirmation that the DOL is higher.

4. Synthesizing for a Directional Bias
Now, let's combine these elements into a systematic process for anticipating the DOL. This involves a multi-timeframe approach, starting from the big picture and drilling down.
Step 1: Establish Higher Timeframe (HTF) Context
Look at the Daily or 4-hour chart. Is the overall market structure bullish (making higher highs and lows) or bearish (making lower lows and highs)? Identify the major external liquidity pools (e.g., last week's high/low). This gives you your macro directional bias.
Step 2: Identify a Catalyst
Zoom into a lower timeframe (e.g., 1-hour or 15-minute). Has there been a recent, significant event? This is often a liquidity sweep of a key level (like the previous day's low) or a reaction from a major HTF PD Array.
Step 3: Seek Confirmation Through Price Delivery
This is where you apply the "respect vs. disrespect" logic. As price moves after the catalyst, observe its interaction with the PD arrays it encounters.
The final video segment puts this entire process together.
How to Find the Draw on Liquidity EASILY! (DOL) - ICT Concepts
Let's finish with the Justin Werlein video. This section shows how to align the bias across multiple timeframes to build a high-conviction trade idea based on the confirmed DOL.
Watch from 05:49 to 09:04. Notice how he combines a bullish bias from the bigger picture, a liquidity sweep on the smaller timeframe, and the disrespect of bearish PD arrays to confirm that the draw on liquidity is the higher swing high. This alignment is what creates high-probability setups.
5. Liquidity Run vs. Liquidity Sweep
Finally, it's essential to clarify the difference between a liquidity run and a liquidity sweep, as anticipating the DOL depends on which one is happening.
ICT Liquidity Sweep vs. Liquidity Run
The article 'ICT Liquidity Sweep and Liquidity Run' offers clear definitions that will help you distinguish between these two scenarios.
Read the sections 'How to Anticipate the Liquidity Sweep?', 'What is ICT Liquidity Run?', and 'How to Anticipate the Liquidity Run?'. Focus on how the higher timeframe market structure is the key to determining whether a move on liquidity is for reversal (sweep) or continuation (run).
Here's the summary:
- Liquidity Sweep (Reversal): Price takes out liquidity (e.g., a high) and then reverses. You anticipate this when it happens against the main market structure trend (e.g., sweeping a high in a bearish market) or into a major HTF PD array in a premium/discount zone. The DOL is then in the opposite direction of the sweep.
- Liquidity Run (Continuation): Price takes out liquidity and continues in that direction. You anticipate this when the move is in line with the prevailing market structure (e.g., taking out a high in a clear uptrend). The DOL is the next logical high or HTF PD Array in the same direction.
Understanding the HTF context is what tells you whether to expect a reversal or a continuation after liquidity is taken.
Conclusion
You've now completed the foundational module on liquidity. You've learned what liquidity is, how to identify where it pools, how to spot it being swept, and today, how to use that information to anticipate where the market is headed next.
Key Takeaways:
- The Draw on Liquidity (DOL) is the market's next price objective. It can be external (swing points) or internal (PD Arrays).
- Displacement is the primary clue. Strong, impulsive price action reveals the market's intended direction.
- The ultimate confirmation comes from observing whether price is respecting friendly PD arrays or disrespecting opposing ones.
- Anticipating the DOL is a process of synthesizing HTF structure, a price catalyst (like a sweep), and confirmation from price delivery.
- The HTF market structure helps you determine whether to expect a liquidity run (continuation) or a liquidity sweep (reversal).
Preview of the Next Lesson:
Now that you can form a directional bias by identifying the Draw on Liquidity, the next logical step is to ask: "Where is the best place to enter a trade in that direction?" This brings us to our next module, Premium and Discount Arrays. In the next lesson, you will learn how to divide a price range into premium (expensive) and discount (cheap) zones to find high-probability areas for trade entries.