Hello! Welcome to the first lesson of our fourth module, "Premium and Discount Arrays."
In our last lesson, we focused on determining the market's likely direction by identifying the Draw on Liquidity (DOL). You learned how to form a directional bias—a hypothesis on whether the price is headed up or down. Now, once you have that bias, the next critical question is: At what price should I enter a trade?
This is where the concepts of premium and discount come into play. The core principle, which should resonate well with your business background, is simple: buy assets when they are cheap (at a discount) and sell them when they are expensive (at a premium). To do this objectively in trading, we first need to define what "cheap" and "expensive" mean in the context of a price chart.
Today's lesson focuses on the very first step in this process. Our learning outcome is to calculate the 50% equilibrium level of a price range. This single price level is the dividing line between premium and discount and is a cornerstone of the ICT methodology.
1. The Concept of Equilibrium
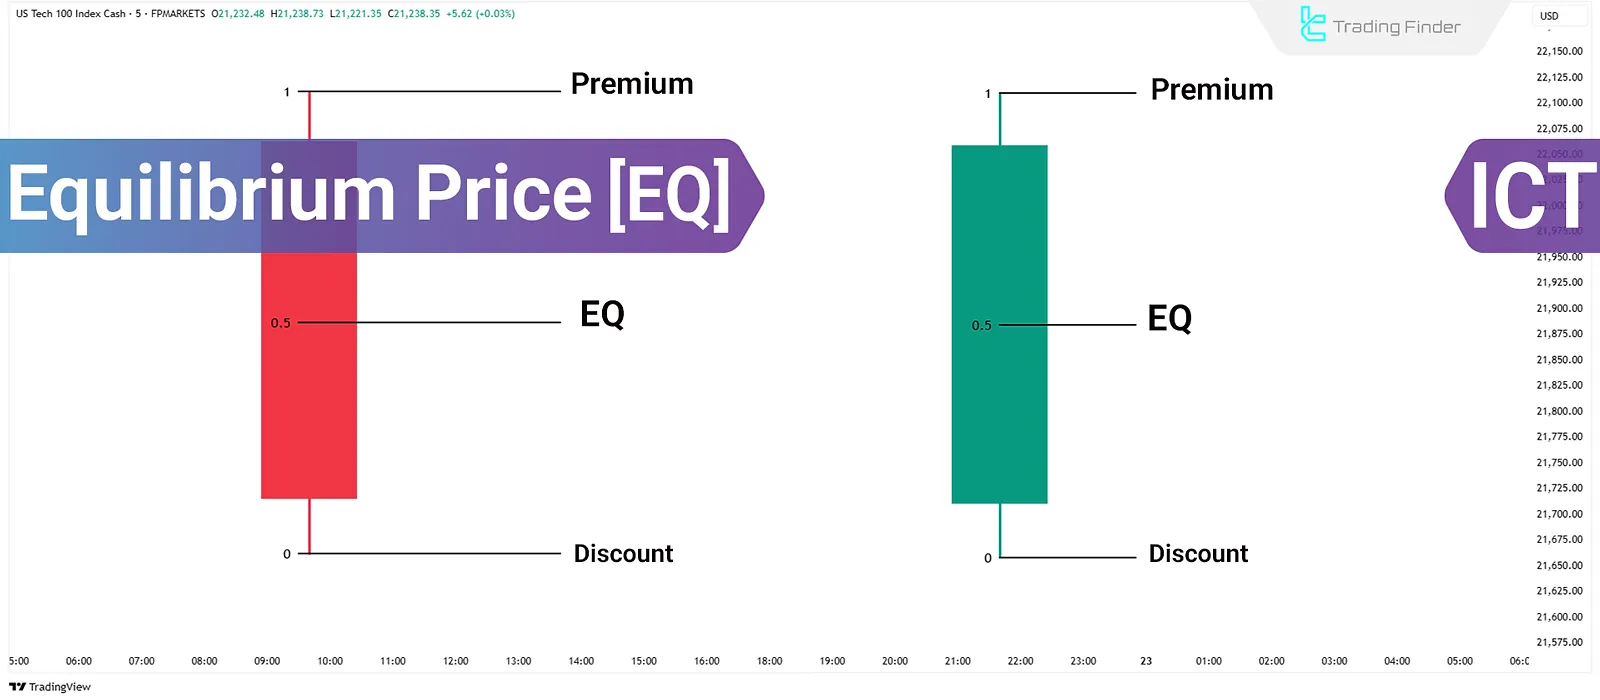
In any market, there is a price level that represents a state of balance or "fair value" between buyers and sellers within a specific range of trading. In ICT, we call this the equilibrium.
- Prices above equilibrium are considered expensive, or trading at a premium.
- Prices below equilibrium are considered cheap, or trading at a discount.
The equilibrium is always found at the exact midpoint of a price range—the 50% level.
To understand how this framework is structured, let's start with a foundational reading.
PD Arrays in ICT: What They Are and How They Work
The article 'PD Arrays in ICT: What They Are and How They Work' from FXOpen clearly introduces this concept. It explains how the 50% level acts as the dividing point.
Please read the section titled 'Premium and Discount Zones of a PD Array'. Focus on how a significant price swing is divided into two zones by the 50% equilibrium point.
2. Identifying the Price Range
Before you can calculate the midpoint, you must first define the boundaries of the price range you are analyzing. In ICT, a "range" is typically the price leg created by an impulsive move, defined by its starting and ending points.
These points are the swing low and swing high that frame the move. You've already learned to identify these in our first module. The process is:
- Identify a clear, impulsive price leg on your chart.
- Mark the swing low at the bottom of the leg.
- Mark the swing high at the top of the leg.
This swing low and swing high define your range. The short video below provides a quick visual refresher on identifying a range.
The ONLY Premium and Discount Trading Guide Youll EVER Need
The video 'The ONLY Premium and Discount Trading Guide Youll EVER Need' by Tom Crown starts with a great, concise explanation of how to identify a trading range.
Watch the first 45 seconds of the video (00:00 - 00:45). Pay attention to how the presenter identifies a 'swing high' and a 'swing low' to mark out the 'most relevant price leg'.
3. Calculating the 50% Equilibrium Level
Once you have your swing high and swing low, you can find the equilibrium in two ways: by manual calculation or by using a chart tool.
Method 1: The Mathematical Formula
The most precise way to find the equilibrium is with a simple formula. This removes all subjectivity.
Discount & premium zones in ICT trading - Equiti
The article 'Discount & premium zones in ICT trading' by Equiti provides the exact formula for this calculation.
Read the section 'How to identify premium area'. Find the part that mentions 'If you are a math fan'. This section gives you the midpoint formula.
As the article states, the formula for the equilibrium price is:
Example:
Let's say on EUR/USD, an impulsive move creates a swing low at 1.07250 and a swing high at 1.08250.
- Swing High = 1.08250
- Swing Low = 1.07250
Plugging these into the formula:
The equilibrium price for this range is 1.07750.

Method 2: The Fibonacci Retracement Tool
While the formula is precise, the most practical and common way traders find the equilibrium is by using the Fibonacci Retracement tool available on all charting platforms.
By default, this tool shows many levels, but for our purpose, we only need three:
- 1 (or 100%) representing the swing high.
- 0 (or 0%) representing the swing low.
- 0.5 (or 50%) representing the equilibrium.
You can usually edit the tool's settings to hide the other levels for a cleaner chart.
The following video demonstrates how to apply this tool to a price chart.
Discount & Premium - ICT Concepts
The video 'Discount & Premium - ICT Concepts' by TTrades shows the practical application of the Fibonacci tool to find the 50% level on different price ranges.
Watch from 00:30 to 01:43. Observe how the presenter draws the Fibonacci tool from the low to the high of a displacement range (for a long setup) and from the high to the low (for a short setup). In both cases, the 0.5 level marks the equilibrium.
As you saw, the process is straightforward:
- For a bullish range (price moved up), click the swing low first, then drag the tool to the swing high.
- For a bearish range (price moved down), click the swing high first, then drag the tool to the swing low.
The tool will automatically calculate and display the 0.5 line, marking your equilibrium price.
Your Turn: Practice
Now it's time to apply what you've learned.
- Open your trading platform (e.g., TradingView).
- Pick any currency pair or asset you like to follow.
- Look for a recent, clear impulsive move on the 1-hour or 4-hour chart.
- Identify the swing high and swing low of that move. Note down their prices.
- First, calculate the equilibrium price manually using the formula.
- Then, use the Fibonacci Retracement tool to draw the range from the low to the high (or vice-versa).
- Verify that the 0.5 level shown by the tool matches your manual calculation.
This simple exercise will solidify your ability to find this crucial level quickly and accurately.
Conclusion
Congratulations on completing this foundational lesson. You now have an objective method for analyzing any price range and finding its "fair value" point.
Key Takeaways:
- The equilibrium is the 50% midpoint of a trading range, representing a fair value price.
- A trading range is defined by a significant swing high and swing low.
- The equilibrium can be calculated with the formula: (Swing High + Swing Low) / 2.
- Practically, the Fibonacci Retracement tool is used to quickly identify the 0.5 level, which marks the equilibrium on a chart.
Preview of the Next Lesson:
Now that you can precisely identify the equilibrium, we will officially define the zones above and below it. In the next lesson, "Define premium and discount zones in relation to equilibrium," you will learn how to use this dividing line to frame high-probability areas for buying and selling, bringing you one step closer to executing trades like an ICT practitioner.