Welcome back! In our previous lesson, we established the theoretical foundation for one of ICT's most critical concepts: the Fair Value Gap (FVG). You learned that an FVG is a three-candle pattern representing a price imbalance or inefficiency, and we introduced the specific terms Bisi (bullish FVG) and Sibi (bearish FVG).
Today, we transition from theory to practice. The goal of this lesson is to develop your ability to spot these imbalances quickly and accurately on a price chart. Being able to identify FVGs is not just a pattern-recognition exercise; it is the first step in seeing the market through the lens of institutional price delivery.
1. The FVG Pattern: A Quick Review
Before we dive into chart examples, let's refresh our memory of the basic three-candle structure for both bullish and bearish Fair Value Gaps.
Master Fair Value Gaps In JUST 5 Minutes
This short video from Tom Crown provides a very fast and clear visual recap of the three-candle rule for both bullish and bearish FVGs.
Please watch from 00:24 to 01:00. Focus on the core rule: the non-overlapping wicks of the first and third candles.
This simple, mechanical rule is the basis for everything that follows. Now, let's apply it.
2. Identifying the Bullish FVG (Bisi)
A bullish FVG, or Bisi (Buy-side Imbalance, Sell-side Inefficiency), forms during an aggressive upward move. It signals a range where buying pressure was so intense that sellers could not provide enough liquidity to create an efficient, two-sided market.
Understanding fair value gap (FVG) in ICT trading
For a clear, textbook definition and diagram, let's turn to this article from Equiti.
Read just the short section titled '1. Bullish FVG', including the diagram. Notice how the gap is the space between the high of Candle 1 and the low of Candle 3.
Now, let's see how to find these on a live chart. It's a process of scanning price and applying the three-candle rule.
Fair Value Gap Simplified - Smart Money Course
The following clip from Smart Risk provides a step-by-step walkthrough of identifying multiple bullish FVGs within a price leg.
Watch from 08:04 to 10:04. Pay attention to how the narrator systematically moves up the price swing, evaluating each three-candle sequence to see if it qualifies as an FVG.
3. Identifying the Bearish FVG (Sibi)
Conversely, a bearish FVG, or Sibi (Sell-side Imbalance, Buy-side Inefficiency), occurs during an aggressive downward move. It highlights where selling pressure dominated.
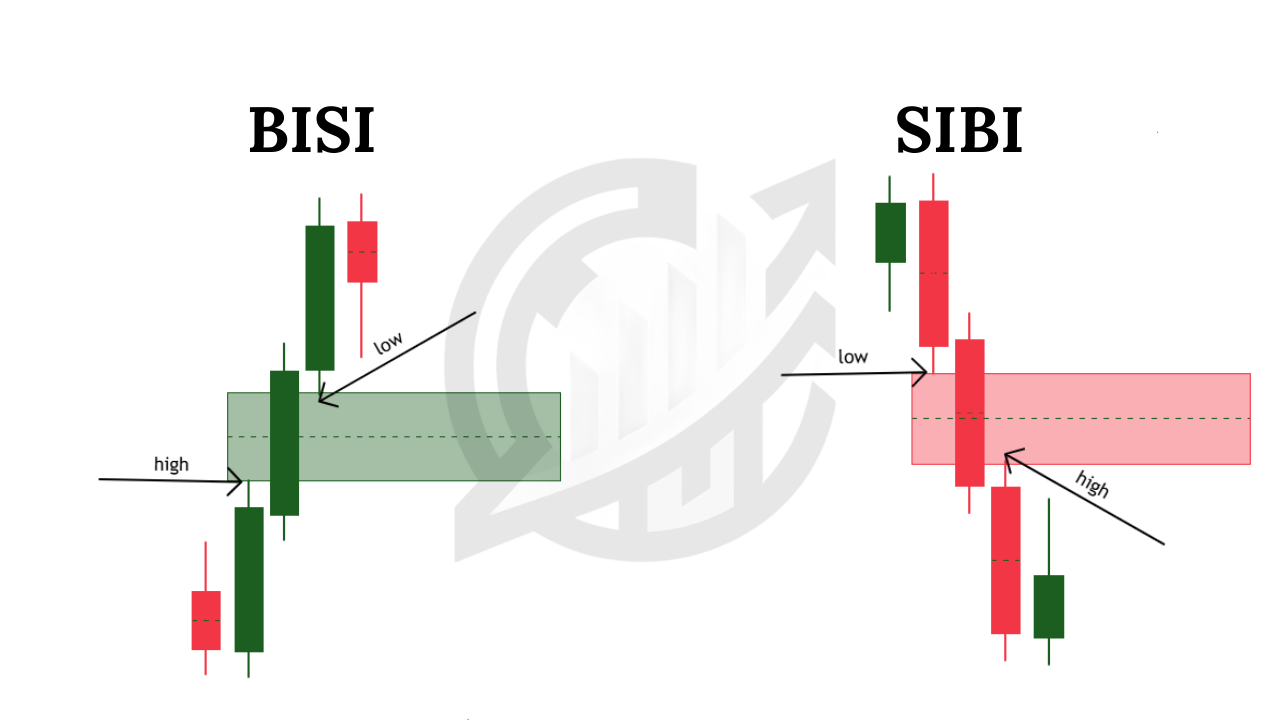
As with the bullish FVG, the identification is purely mechanical.
Understanding fair value gap (FVG) in ICT trading
Let's return to the Equiti article for the definition of a bearish FVG.
This time, please read the section titled '2. Bearish FVG' and look at its corresponding diagram.
4. An Important Exception: The Inside Bar
While the three-candle rule is standard, there's a common scenario that requires you to look at four candles instead. This occurs when an inside bar is part of the sequence. An inside bar is a candle whose entire range (high to low) is contained within the range of the previous candle.
When this happens, you must adjust how you identify the FVG to get the correct range.
Fair Value Gap Simplified - Smart Money Course
The Smart Risk video we've been using has an excellent segment explaining this specific exception.
Watch from 03:03 to 03:58. The key takeaway is that when the first candle of a potential FVG sequence is an inside bar, you must use the candle before it (the 'mother bar') as your new 'candle 1' for identification purposes.
This is a subtle but crucial detail. Ignoring this rule can lead you to mark an invalid or poorly defined FVG. Now, let's see this exception applied in a real chart example.
Fair Value Gap Simplified - Smart Money Course
This next segment demonstrates identifying bearish FVGs and applies the four-candle inside bar rule we just learned.
Watch from 10:04 to 12:18. Notice how the narrator first identifies a clear bearish FVG at the top. Then, he points out an inside bar pattern and correctly uses a four-candle sequence to identify the next valid FVG.
5. Practice: Train Your Eyes
You now have all the rules needed to identify FVGs like a professional. The final and most important step is practice. Your goal is to make this recognition second nature.
Your Task (20-25 minutes):
- Open your charting platform (like TradingView).
- Choose a liquid asset you are familiar with (e.g., EUR/USD, SPY, BTC/USD).
- Set your chart to a specific timeframe, like the 1-hour (H1) or 15-minute (M15).
- Scroll back through historical price data and try to find and mark the following:
- 5 clear examples of a Bullish FVG (Bisi)
- 5 clear examples of a Bearish FVG (Sibi)
- As you find them, use your platform's drawing tools (like the rectangle) to precisely mark the zone from the first candle's wick to the third candle's wick.
- Actively look for any instances where the inside bar rule applies.
This exercise is designed to move the knowledge from the screen into your analytical process. Don't worry about what the price does after the FVG is formed for now; just focus purely on identification.
Conclusion
Well done. Today you've translated the theory of Fair Value Gaps into a practical, repeatable skill. You can now scan a price chart and pinpoint the exact locations where the market has shown its hand through inefficient price delivery.
Key Takeaways:
- Bullish FVG (Bisi): A three-candle pattern where the high of candle 1 does not overlap the low of candle 3.
- Bearish FVG (Sibi): A three-candle pattern where the low of candle 1 does not overlap the high of candle 3.
- The Inside Bar Exception: If the first candle in a potential sequence is an inside bar, you must use the prior candle (the "mother bar") as your reference for candle 1, creating a four-candle sequence for identification.
- Identification is a mechanical skill that improves with deliberate practice.
Preview of the Next Lesson:
Now that you can consistently identify FVGs, we'll begin to explore their practical significance. In our next lesson, we will focus on how price interacts with these zones when it returns to them. Specifically, we will explain the significance of consequent encroachment, which refers to the 50% level of the FVG and is a critical concept for trade entries and analysis.