Hello! Welcome to the next lesson in your ICT trading course.
In our last lesson, we focused on using Fair Value Gaps (FVGs) as high-probability points of interest for entering trades. We learned the core entry model (Liquidity Grab → Displacement → FVG) and how to refine entries using confluence with other ICT concepts.
Now that you know how to get into a trade, it's time to answer the next logical question: where do you get out? This lesson is dedicated to the learning outcome: Identify potential profit targets using Fair Value Gaps as draws on liquidity. We will explore the concept of the "Draw on Liquidity," which provides a logical, objective framework for setting your profit targets.
1. From Entry to Exit: The "Draw on Liquidity"
In the ICT methodology, price is viewed as being algorithmically delivered. It doesn't move randomly; it moves with purpose from one specific area of liquidity to another. The destination that the algorithm is seeking is called the Draw on Liquidity (DOL).
When you enter a trade based on an FVG, you are entering at one point of inefficiency. Your profit target should be the next logical point of inefficiency or liquidity that the market is reaching for.
To begin, let's get a clear definition of what constitutes a "Draw on Liquidity."
Draw on Liquidity (DOL) - ICT Concepts
The video 'Draw on Liquidity (DOL) - ICT Concepts' from the TTrades channel provides a concise introduction to this idea. It explains that the market seeks both external and internal liquidity.
Please watch the segment from 00:32 to 01:24. Focus on the two main categories of liquidity the market searches for: external and internal.
As the video explains, the Draw on Liquidity can be categorized as:
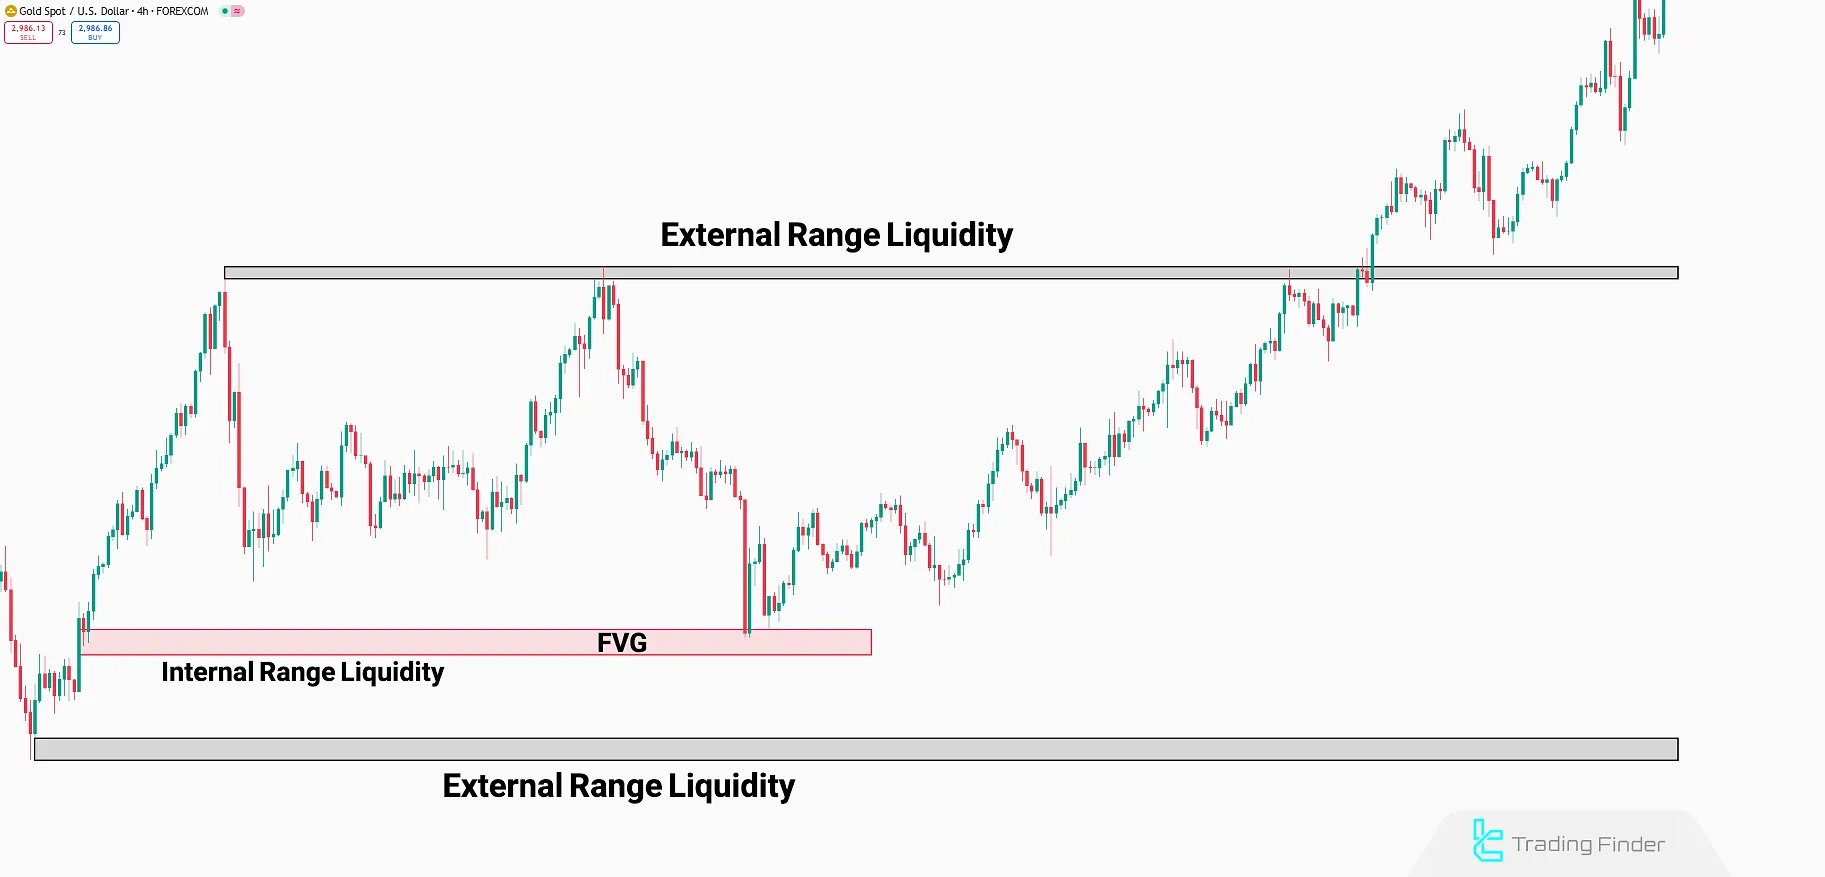
- External Range Liquidity: These are the most obvious pools of liquidity that rest above and below a price range. Think of old swing highs and lows, session highs/lows, and equal highs/lows.
- Internal Range Liquidity: These are inefficiencies that exist within a price range. Fair Value Gaps are a prime example of internal range liquidity.
This means that after you enter a trade, your target can be either an old high/low (external) or another FVG (internal).

2. Fair Value Gaps as Price Magnets
You've learned that price often returns to FVGs to rebalance. This quality makes them not only good entry points but also powerful magnets for price, and therefore, excellent profit targets.
The logic is simple:
- If you are in a long trade, an unmitigated bearish FVG located above your entry is a logical draw on liquidity and a potential profit target.
- If you are in a short trade, an unmitigated bullish FVG below your entry is a logical draw on liquidity and a potential profit target.
The following resource explains this relationship clearly.
Draw on Liquidity (DOL) in ICT; [BSL + SSL] Liquidity Levels
The article 'Draw on Liquidity (DOL) in ICT' from TradingFinder explicitly discusses how FVGs act as targets.
Please read the section titled 'Fair Value Gap (FVG)'. It directly states that these gaps create 'ideal zones for Draw on Liquidity (DOL) moves' and provides a clear example.
Now, let's watch a practical example of price being drawn into an FVG, which serves as a profit target.
Draw on Liquidity (DOL) - ICT Concepts
We'll return to the TTrades video. This segment demonstrates the concept we just discussed: price displacing higher and rushing directly into an FVG, fulfilling its role as a draw on liquidity.
Watch the clip from 02:20 to 03:00. Notice how after the upward displacement, the presenter identifies the bearish FVG above as the likely draw, which is then quickly filled.
3. The Litmus Test: Respect vs. Disrespect
How do you gain confidence that price is truly heading for your intended target? The market provides clues by how it interacts with the PD Arrays (Price Delivery Arrays, like FVGs and Order Blocks) it encounters along the way. This is the concept of respect versus disrespect.
- Respect: When price reaches a PD Array that should support it (e.g., a bullish FVG in an uptrend) and bounces off, it is "respecting" that level. This confirms the current directional bias.
- Disrespect: When price slices straight through a PD Array that should have held it, it is "disrespecting" that level. This is a powerful signal that the market's intention has changed, and the Draw on Liquidity is now in the opposite direction.
Understanding this dynamic is key to determining the true DOL.
How to Find the Draw on Liquidity EASILY! (DOL) - ICT Concepts
Justin Werlein's video on DOL provides an excellent explanation of this 'respect vs. disrespect' framework. It's the core of how you can dynamically read price action to determine the most likely target.
Please watch the segment from 01:34 to 04:00. The key takeaway is his rule: 'I am bearish until a bearish PD array is getting disrespected'. This is the central idea. When a bearish FVG is broken, the draw becomes the high above it.
This principle gives you a way to validate your profit target in real-time. For instance, if you are in a long trade targeting a bearish FVG far above, you want to see price respecting the bullish FVGs it forms on the way up. If it suddenly breaks down and disrespects a key bullish FVG, it's a sign that your target may not be reached, and you might consider managing your trade.
4. A Framework for Setting Targets
Now, let's combine these ideas into a practical framework for setting your take-profit levels.
The ICT Silver Bullet Trading Strategy - FXOpen UK
The article 'The ICT Silver Bullet Trading Strategy' has a very practical section on setting take-profit orders that summarizes our discussion perfectly.
Please read the short subsection titled 'Take Profit'. It provides clear, actionable advice on targeting liquidity points.
Based on this, here is a simple process:
- Identify Potential Targets: Once you have entered a trade, immediately scan your chart (and higher timeframes) for the next logical Draws on Liquidity in the direction of your trade. These could be:
- An opposing FVG.
- An old swing high or low.
- A pool of equal highs or lows.
- Select the Clearest Target: Choose the most obvious liquidity pool as your primary target. Often, this will be the first significant FVG or swing point price is likely to reach.
- Validate with Price Action: As price moves towards your target, observe whether it is respecting the PD arrays aligned with your trade direction and disrespecting the opposing ones. This confirms the DOL is still valid.
- Set Your Order: Place your take-profit order at, or just before, the identified liquidity level to ensure it gets filled.
Conclusion
You have now completed the entire lifecycle of a trade based on a Fair Value Gap, from identification and entry to a logical exit. This moves you from simply spotting patterns to trading a complete narrative—entering at one inefficiency and targeting the next.
Key Takeaways:
- A profit target in ICT is based on the Draw on Liquidity (DOL), which is the level the market is algorithmically targeting.
- Fair Value Gaps are not just for entries; they act as price magnets and are high-probability profit targets.
- The market reveals its intention through the respect or disrespect of PD Arrays. If price breaks through an FVG that should have held it, the DOL has likely shifted.
- The fundamental trading model is to enter at an inefficiency (like an FVG in a discount zone) and target another point of liquidity (like an opposing FVG or an old high).
Preview of the Next Lesson:
We've spent the last several lessons diving deep into the dimension of Price—identifying imbalances, assessing premium/discount, and understanding liquidity. Now, we are going to add the second critical dimension to our analysis: Time.
In the next module, we will begin our study of ICT's time-based concepts. Our first lesson will be to identify the Asian session range and its significance as a source of liquidity. You will learn why the time of day you trade is just as important as the price levels you watch.