Hello! Welcome back to your second lesson.
In our last session, we built a mental map of how networks operate by exploring the OSI and TCP/IP models. We discussed how data is encapsulated into segments, packets, and frames as it travels down the layers.
Today, we're moving from theory to practice. This lesson is all about using Wireshark, a powerful network protocol analyzer, to see those concepts in action. You will learn to analyze network traffic to identify different protocols and their communication patterns. Since you already have some experience with Wireshark from your labs, we'll focus on structured analysis techniques and powerful features that are fundamental for a penetration tester. This skill allows you to observe, understand, and ultimately find weaknesses in network communications.
1. Wireshark: The Pentester's Magnifying Glass
For a penetration tester, Wireshark is like a magnifying glass for network traffic. It captures the raw data flowing across a network and presents it in a human-readable format. This allows you to verify vulnerabilities, sniff for sensitive data, and understand the "chatter" between devices.
The article "Wireshark Tool for Penetration Testing" gives a good overview of why this tool is indispensable.
Wireshark Tool for Penetration Testing | Beginner Guide
This article explains why Wireshark is a core tool for penetration testing, beyond just basic network troubleshooting.
First, read the section titled 'Why Wireshark for Pentesting?' to understand its role in tasks like detecting unsafe data and discovering hidden hosts. Then, read 'Step 5: Read the Packet List Window' for a refresher on the main interface components and how to read the packet flow for a TCP handshake.
The Wireshark interface is typically divided into three main panes, as you've likely seen:
- Packet List: A summary of each captured packet (frame).
- Packet Details: A detailed, layered view of the selected packet (showing the Ethernet frame, IP packet, TCP segment, etc.). This is where you can see the encapsulation we talked about in the last lesson.
- Packet Bytes: The raw data of the packet in hexadecimal and ASCII.

2. Cutting Through the Noise with Display Filters
A busy network can generate thousands of packets per second. Analyzing this flood of data is impossible without filters. It's crucial to distinguish between two types of filters:
- Capture Filters: Applied before you start capturing. Wireshark will only save packets that match the filter, reducing the size of the capture file. Use this when you know exactly what you're looking for (e.g.,
host 192.168.1.10). - Display Filters: Applied after capturing. They don't delete any packets; they just hide the ones that don't match your criteria. This is far more flexible and what you'll use most of the time during analysis.
The following resource provides an excellent reference for the most common display filters you'll use.
How to Use Wireshark Filters to Analyze Your Network Traffic
This guide from freeCodeCamp is a great cheat sheet for building effective display filters to isolate exactly the traffic you need to see.
Read the section 'Understanding and Applying Basic Display Filters.' Pay close attention to the syntax for filtering by protocol (http, tcp), IP address (ip.addr), and port (tcp.port). Also, note how to combine them using logical operators like and.
Test your understanding!
You are investigating a web server at IP address 10.0.0.50. You want to see all unencrypted login attempts, which typically happen over HTTP as POST requests. How would you combine filters to see only traffic going to this server that matches this pattern?
Show answer
A good filter would be: ip.dst == 10.0.0.50 and http.request.method == "POST"
ip.dst == 10.0.0.50isolates traffic where the destination is your target server.http.request.method == "POST"filters for HTTP POST requests, which are used to submit data from a form.
3. Hands-On Analysis: Identifying Protocols and Patterns
Now let's see these filters in action to identify common protocols and communication patterns. The following video by Chris Greer is a hands-on walkthrough of a TryHackMe room focused on traffic analysis. We'll watch specific clips to see how a professional approaches this. I recommend opening Wireshark on your own machine with a sample capture file to follow along if you can.
Pattern 1: TCP Three-Way Handshake (Layer 4)
As we learned, any reliable connection using TCP begins with a three-way handshake. Identifying this pattern is the first step in analyzing a TCP conversation. It consists of three packets with specific flags set: SYN, SYN-ACK, and ACK.
Hands-On Traffic Analysis with Wireshark - Let's practice!
In this clip, the instructor analyzes a capture of an Nmap TCP connect scan. This type of scan completes the full three-way handshake, making it a perfect example. Watch how he uses display filters to isolate the initial SYN packets.
Watch from 02:45 to 05:20. Notice the filter he builds: tcp.flags.syn == 1 and tcp.flags.ack == 0 to find only the initial SYN packets. He also explains how a completed handshake (SYN, SYN-ACK, ACK) differs from a stealth scan, which is a key concept in penetration testing.
Pattern 2: Cleartext Credentials in Application Protocols (Layer 7)
One of the first things a penetration tester looks for is sensitive data sent "in the clear" (unencrypted). Legacy protocols like FTP, Telnet, and even modern web applications that misconfigure logins over HTTP are prime targets.
The "Follow TCP Stream" feature is your best friend here. It reconstructs the entire conversation and shows you the data exactly as the application sees it.
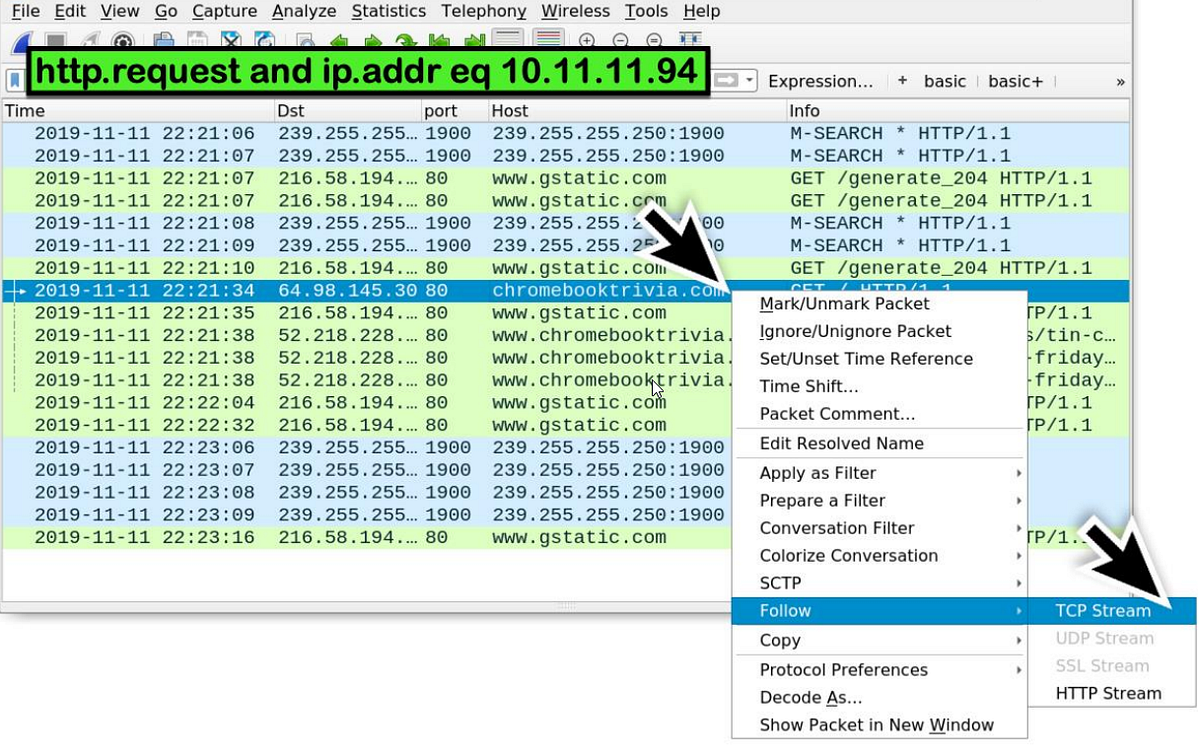
Now, let's see this used to find a password.
Hands-On Traffic Analysis with Wireshark - Let's practice!
This clip demonstrates an ARP poisoning attack, a classic Man-in-the-Middle (MITM) scenario. The attacker intercepts traffic and can view unencrypted data. Watch how easily usernames and passwords sent over HTTP are exposed.
Watch from 11:20 to 14:05. The instructor filters for HTTP traffic and searches for packets containing the string 'username'. He then inspects the packet details to find the credentials sent in a form. This is a perfect demonstration of why pentesters always check for unencrypted HTTP.
FTP is another protocol that sends credentials in cleartext. In the same video, the section from 29:50 to 30:50 shows how to filter for FTP traffic and easily spot the username and password commands.
Pattern 3: Network Reconnaissance with Discovery Protocols (Layers 2 & 3)
Protocols that seem mundane are often a goldmine for reconnaissance. ARP, DHCP, and DNS reveal which hosts are on the network, what their addresses are, and what they are trying to talk to.
- Address Resolution Protocol (ARP) operates at Layer 2 and maps IP addresses (Layer 3) to MAC addresses (Layer 2) on a local network. By watching ARP traffic, you can create a list of all active devices.
- Dynamic Host Configuration Protocol (DHCP) is used to assign IP addresses automatically. Its traffic can reveal hostnames and the IP address range of the network.
This final clip shows how to extract this information.
Hands-On Traffic Analysis with Wireshark - Let's practice!
Here, the instructor investigates a capture file to identify hosts on the network. He uses filters to find DHCP and NetBIOS traffic, pulling out MAC addresses and hostnames.
Watch from 16:10 to 20:30. Pay attention to how he filters for traffic containing a specific string ('Galaxy') to find a DHCP request. By inspecting the DHCP packet details, he extracts the device's MAC address and hostname. This is a common technique used in the initial information gathering phase of a pentest.
Conclusion
Excellent work today! You've taken the theoretical knowledge from our first lesson and applied it in a practical, hands-on way that is directly relevant to your goal of becoming a penetration tester.
Here are the key takeaways from this lesson:
- Wireshark is an essential tool for turning the abstract concepts of the OSI and TCP/IP models into visible, analyzable data.
- Display filters are your most powerful tool for cutting through network noise and focusing on traffic relevant to a security assessment.
- Identifying and analyzing fundamental communication patterns like the TCP three-way handshake is key to understanding network conversations.
- Pentesters actively hunt for cleartext data in protocols like HTTP and FTP. The Follow TCP Stream feature is invaluable for this.
- Even "boring" protocols like ARP and DHCP provide crucial reconnaissance information about hosts on a network.
In our next lesson, we will zoom in on Layer 3. We'll cover IP addressing, subnetting, and calculating network ranges using CIDR notation. This knowledge is critical for mapping out a target network and understanding its boundaries, a foundational step in any penetration test.