Introduction
Welcome back! In our last lesson, we focused on developing a response plan, or OCAP, for out-of-control signals. We concluded by discussing a crucial scenario: when a signal indicates a positive change or an improvement in the process. We established that the correct response is to investigate, understand, and standardize the improvement.
That leads directly to today's topic. Once an improvement is locked in, the old control limits no longer represent the "voice" of your new, better process. Therefore, you must create a new performance baseline. This lesson will teach you how to do just that, addressing our learning outcome: Establish new control limits based on data from the improved process.
This is a critical step in the Control phase of any DMAIC project. It's how you formalize the gains you've made and set the standard for future performance monitoring.
When to Recalculate Control Limits
A common mistake is to frequently adjust control limits in response to minor fluctuations. This practice, known as tampering, often increases process variation. Control limits should remain stable unless the process itself undergoes a fundamental change.
So, when is it appropriate to recalculate them? The primary and most important reason is after you've successfully implemented a process improvement.
To explore this and other valid scenarios, let's turn to an article from SPC for Excel.
When to Calculate, Lock & Recalculate Control Limits - SPC for Excel
This article, 'When to Calculate, Lock & Recalculate Control Limits', provides clear, practical guidelines on this topic. It directly addresses the core question of when recalculation is justified.
Please read the section titled 'When should I recalculate the control limits?'. Pay close attention to the manufacturing safety example and how the control chart visually proves that the process improvement was effective.
As the article emphasizes, the ideal trigger for recalculating control limits is a verified process improvement. The out-of-control signal (like the run below the average in the safety example) is your data-driven proof that the change had a real impact.
For completeness, there are two other common situations where you would change control limits. The following resource summarizes all three.
[PDF] CONTROL CHART - Balanced Scorecard Institute
The 'CONTROL CHART' guide from the Balanced Scorecard Institute provides a concise summary of the valid reasons for changing control limits.
Please read the short section titled 'When should we change the control limits?' (on page 32). This will reinforce the main reason and introduce two others.
To summarize, you should change control limits only in these three situations:
- After a Fundamental Process Change: As we've discussed, this is typically after an improvement project. You use the data from the new process to set the new baseline.
- When Replacing Trial Limits: When you first create a control chart, you might use a small amount of data (e.g., 5-10 subgroups) to set "trial" limits. Once you have more data (e.g., 25-30 subgroups) and the process is stable, you can recalculate to establish more reliable "locked" or "stable" limits.
- After Removing Special Cause Data: If you identify an out-of-control point, find and eliminate its special cause, it's valid to remove that data point from the dataset and recalculate the limits to get a more accurate picture of the common cause variation.
The Recalculation Process: Staged Control Charts
The mechanics of recalculation are straightforward: you apply the same formulas for the centerline and control limits that you used initially, but you use only the data collected after the process change.
The best practice for displaying this transition is to use a staged (or split) control chart. This powerful visual tool shows the old process data with its control limits and the new process data with its own, recalculated limits, all on a single chart. This makes the impact of your improvement project immediately clear to all stakeholders.
The image below shows a perfect example of a staged control chart created in Minitab, a common statistical software package.
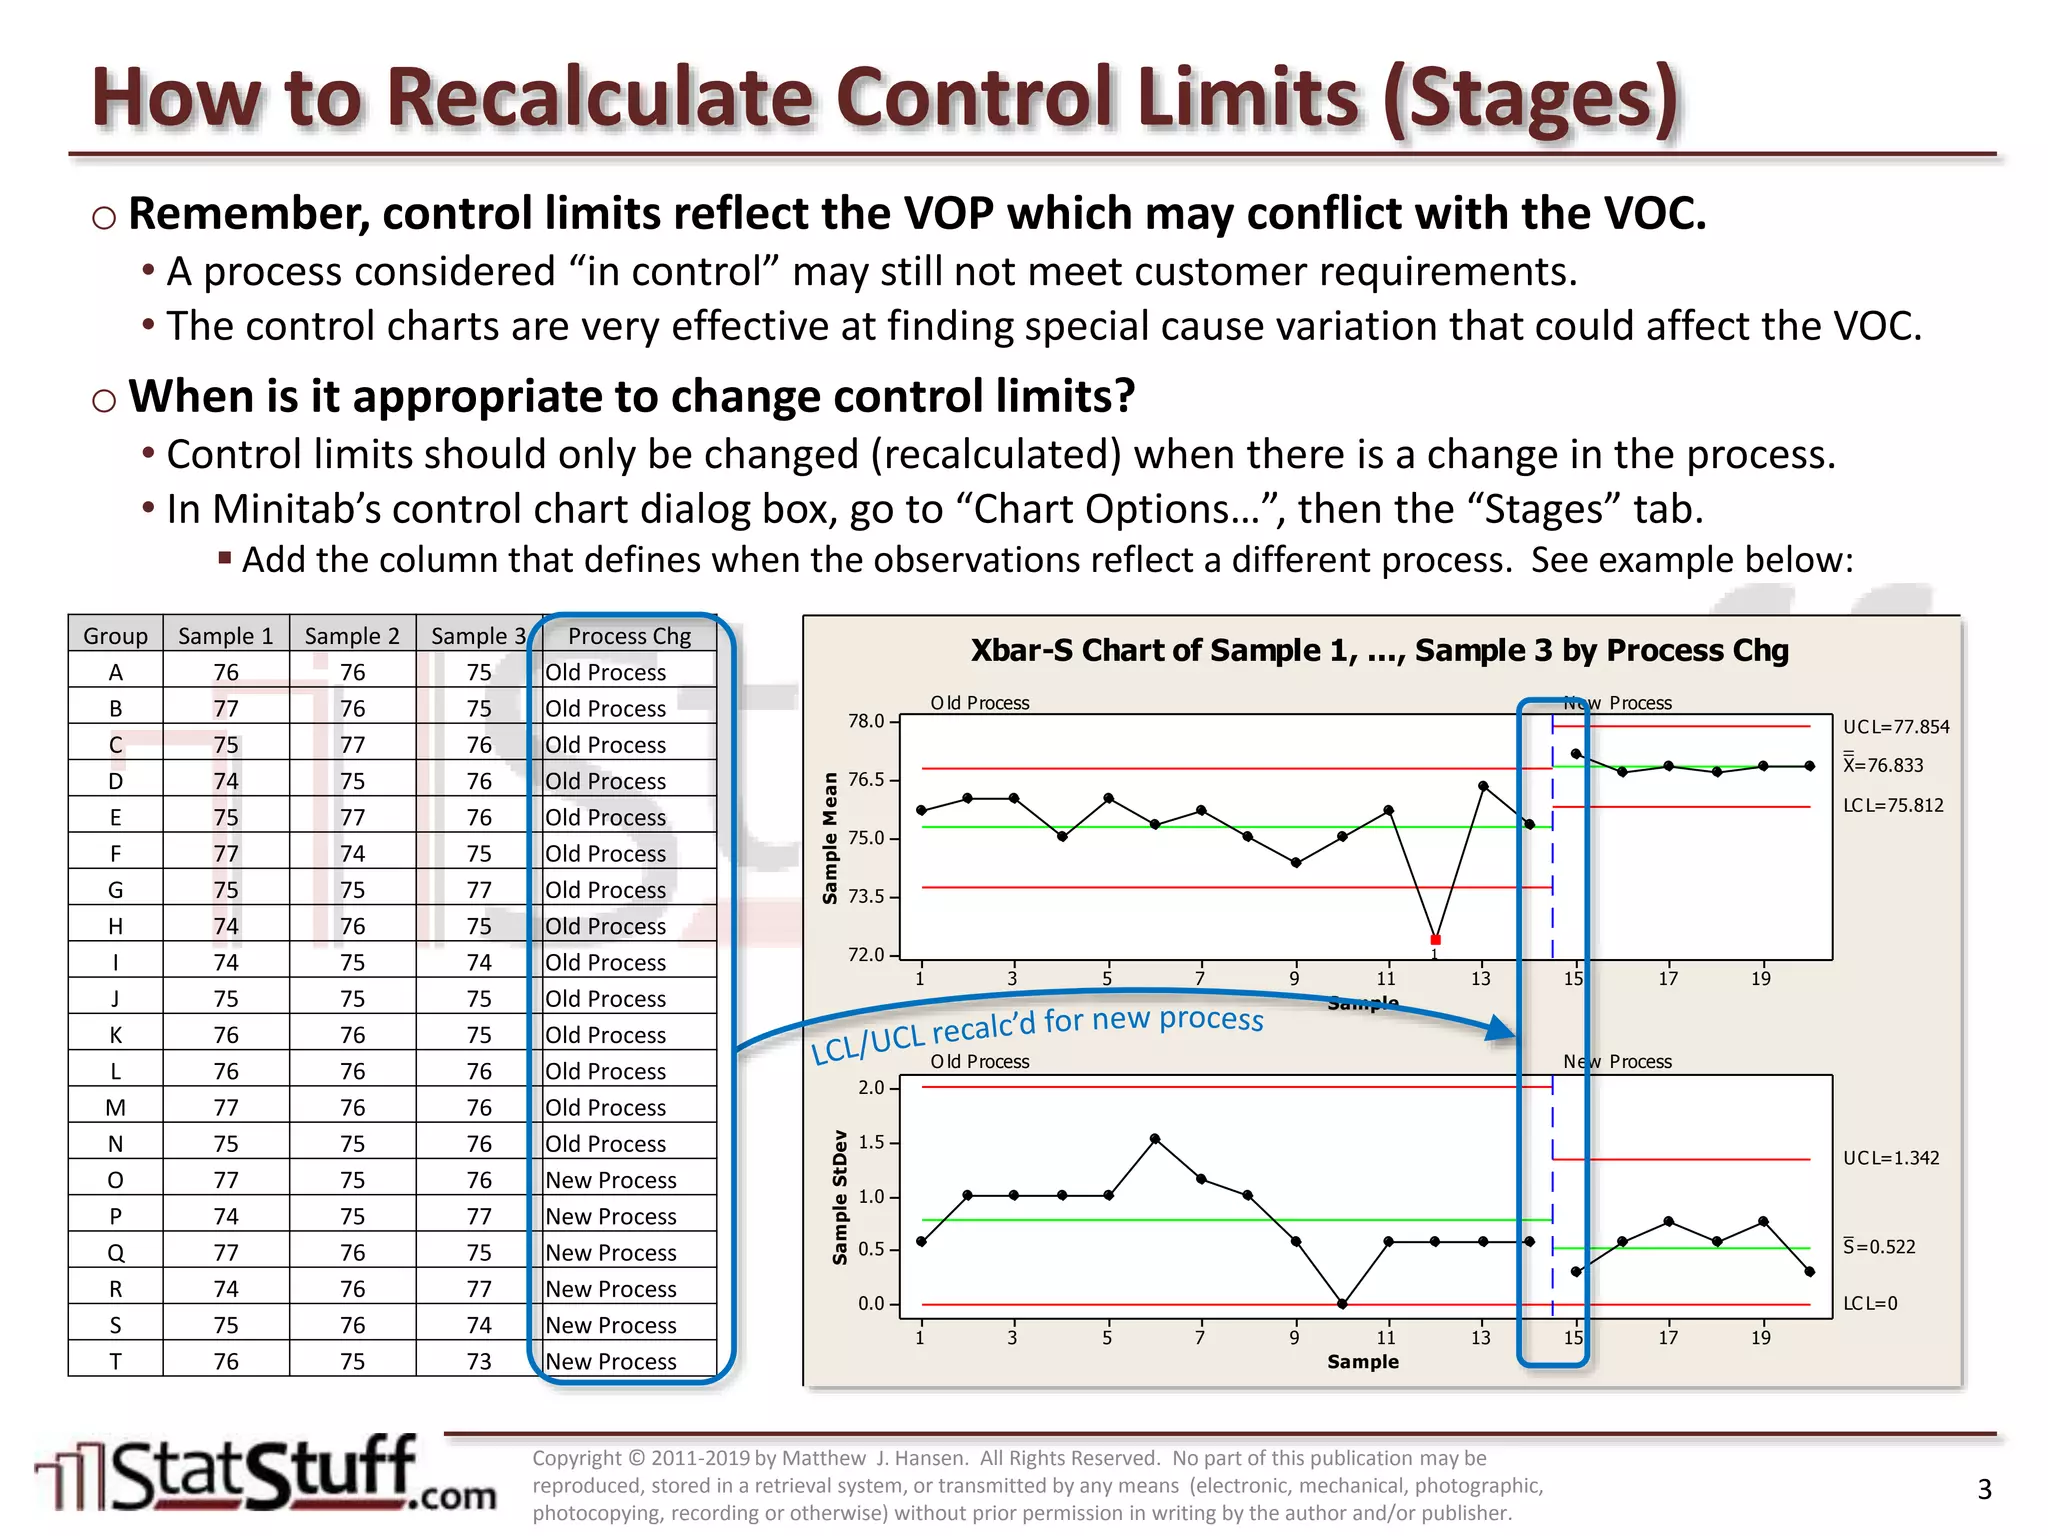
Notice how the chart is split into two distinct phases. The "New Process" stage has a lower mean (X-bar) and reduced variation (a lower average standard deviation, S). The new control limits are calculated based only on the data points from sample 21 onwards. This is the goal of a DMAIC project visualized on one page.
Practical Application: Recalculating Inflated Limits
Now, let's work through a practical example of recalculation. This scenario, from the Balanced Scorecard Institute guide, involves an I-MR chart where the initial limits are found to be "inflated" or misleading due to the nature of the variation. Correcting these limits is a necessary step to establish a valid baseline for monitoring. This is a form of process improvement—improving the monitoring system itself.
The guide provides an exercise with a dataset. Your task is to see why the original limits are flawed and how new, more accurate limits are established.
[PDF] CONTROL CHART - Balanced Scorecard Institute
Let's apply these concepts using 'EXERCISE 2' from the 'CONTROL CHART' guide. This exercise will walk you through detecting flawed limits and recalculating them.
Focus on 'EXERCISE 2' (starting on page 37). First, review the dataset provided. Read through questions 6, 7, and 8. Then, carefully examine the 'ANSWER KEY' and the corresponding charts (Viewgraph 27 and Viewgraph 28) to understand the solution. Your goal is to understand why the limits were considered inflated (Question 6) and what values were used to recompute the new, more accurate limits (Question 8).
Let's break down what happened in that exercise:
- Initial Analysis (Viewgraph 27): The first chart was plotted using the standard I-MR formulas.
- Problem Detection (Question 6): The analysis revealed two issues: a point was outside the UCL on the Moving Range chart, and over two-thirds of the MR points were below the centerline. These are classic signs of inflated limits, meaning the estimate of variation is artificially high, making the control limits on the Individuals chart too wide and less sensitive to process shifts.
- The Solution (Questions 7 & 8): The procedure dictates that when limits are inflated, you must recalculate them. Instead of using the average moving range, you use the median moving range, which is more robust to outliers. The new, tighter limits were calculated using this median value.
- Final Result (Viewgraph 28): The revised chart shows a more accurate picture of the process variation. The new limits are based on a more stable estimate of variation, providing a better baseline for future monitoring.
This exercise provides a concrete example of identifying a problem with existing control limits and taking corrective action by recalculating them to establish a more valid representation of the process.
Conclusion
You have now learned the formal procedure for updating your process baseline after a change. This ensures that your control charts remain a relevant and powerful tool for monitoring process stability long after an improvement project is complete.
Key Takeaways:
- Control limits should only be recalculated when there has been a fundamental and permanent change to the process. The most common reason is a planned process improvement.
- New limits must be calculated using only the data from the new process period.
- Staged control charts are the best practice for visually communicating the "before" and "after" states of your process, clearly demonstrating the impact of your improvements.
- Recalculation establishes the new baseline for performance, allowing you to monitor the improved process for stability and control moving forward.
Preview of the Next Lesson:
Establishing these new control limits is a cornerstone of the Control phase. In our next lesson, we will formalize this and other control measures. The learning outcome is: Develop a formal Control Plan identifying key process variables, control methods, and reaction plans. You will see how the new control limits you've just learned to calculate, along with the OCAPs we designed previously, are documented in this critical document to ensure your project's gains are sustained.