Introduction
Welcome to the next lesson in our journey to formalize your Six Sigma expertise. In our previous lessons, we've focused on preparing your data for analysis. You've learned to test for normality and, when necessary, apply a Box-Cox transformation to ensure your data is ready for the powerful statistical tools that are central to Six Sigma.
Now that we have data we can trust, we can finally answer a critical business question: "Is my process capable of consistently meeting my customer's requirements?"
Today's lesson addresses the learning outcome: Calculate and interpret Cp, Cpk, Pp, and Ppk indices to assess process capability against specifications. We will demystify this "alphabet soup" of metrics. You'll learn what each index measures, why they are different, and how to use them together to get a complete picture of your process's health. This is a cornerstone of the Measure and Analyze phases of any DMAIC project.
1. From Potential to Reality: Cp and Cpk
The fundamental idea of process capability is simple: we compare the "Voice of the Customer" (the specification limits, or USL and LSL) with the "Voice of the Process" (the natural variation of your output).
Process Potential (Cp)
The simplest capability index is Cp, or Process Capability. It asks a very basic question: Is the width of my process variation narrow enough to fit within the width of the customer's specification?
The formula for Cp is:
Here, represents the spread that contains 99.73% of your process output, assuming it's stable and normally distributed.
However, Cp has a major flaw: it completely ignores where your process is centered. A process could have a great Cp value but still produce 100% defects if its average is outside the specification limits. Because it assumes perfect centering, Cp measures the potential capability of your process, not its actual performance.
Process Capability (Cpk)
To get a more realistic measure, we use Cpk, the Process Capability Index. Cpk improves on Cp by taking the process mean () into account. It measures the distance from the process mean to the nearest specification limit.
The formula for Cpk is:
By taking the minimum of the two sides, Cpk essentially reports the "worst-case scenario." It tells you the capability of your process considering both its variation and its centering.
The following video provides an excellent visual explanation of the difference between Cp and Cpk and why Cpk is the more useful metric for real-world applications.
PROCESS CAPABILITY: Explaining Cp, Cpk, Pp, Ppk and HOW TO INTERPRET THOSE RESULTS
The video 'PROCESS CAPABILITY' from CQE Academy provides a clear, visual explanation of why Cpk is a more accurate reflection of process capability than Cp.
Please watch the segment from 02:17 to 07:30. Focus on: How the Cp value can be misleading when a process is not centered. The analogy of Cpk 'penalizing' off-center processes. The example calculation showing how Cpk changes when the process is centered versus when it is not.
2. Short-Term vs. Long-Term: The "C" vs. the "P"
You now understand the difference between Cp (potential) and Cpk (actual, centered capability). The next key distinction is between Capability (C) and Performance (P). This is a concept that will be very familiar from your experience on the factory floor.
-
Cp and Cpk are short-term measures. They use a standard deviation () calculated from the variation within rational subgroups of data (e.g., from an X-bar and R control chart). This represents the inherent, "best-case" variation of a process when it's in a state of statistical control. It's the "potential" of the machine and process under ideal, controlled conditions.
-
Pp and Ppk are long-term measures. They use the overall standard deviation () calculated from all individual data points in the study. This captures all sources of variation over time—including shifts between setups, operator differences, material batch changes, and environmental fluctuations. It tells you the actual performance the customer has been experiencing.
In essence:
- Cpk tells you what your process can do.
- Ppk tells you what your process is actually doing.

The article below provides an excellent summary and comparison tables that clarify these distinctions.
Ppk vs Cpk: Process Capability Explained (With Examples)
The article 'Ppk vs Cpk: Process Capability Explained' from AMREP Inspect offers clear tables that are perfect for understanding the practical differences.
Please read the following sections from the article: 'What Are Cp, Cpk, and Ppk?': Focus on the initial overview table. 'The Key Difference Between Cpk and Ppk': Study this comparison table carefully. It's the core of this section. 'When to Use Cpk vs Ppk': Read the brief examples for when each is most appropriate. These sections provide a concise, practical summary.
3. Calculation and Practical Interpretation
Now let's bring everything together. How do we calculate these values and, more importantly, what do they mean for our manufacturing process?
A Step-by-Step Calculation Example
The best way to understand the calculation is to walk through an example. The same article we just reviewed provides a clear, step-by-step calculation.
Ppk vs Cpk: Process Capability Explained (With Examples)
This section of the 'Ppk vs Cpk' article demonstrates the full calculation for both indices from a sample dataset.
Read the section 'Step-by-Step Example: Ppk vs Cpk Calculation'. Follow the five steps from the scenario to the final interpretation. Notice how the difference between the within-subgroup \sigma (0.05 mm) and the overall standard deviation s (0.07 mm) leads to different results for Cpk and Ppk.
Interpreting the Numbers
Knowing how to calculate the indices is only half the battle. As a Six Sigma practitioner, your real value is in interpreting them to drive decisions.
General Benchmarks:
A common minimum acceptance value for Cpk or Ppk in many industries is 1.33. A value below 1.0 is considered unacceptable.
| Cpk / Ppk Value | Interpretation |
|---|---|
| < 1.0 | Process is not capable; produces many defects. |
| 1.0 to 1.33 | Process is marginally capable; requires monitoring. |
| > 1.33 | Process is considered capable. |
| > 1.67 | Process is highly capable. |
| > 2.0 | World-class or "Six Sigma" level of capability. |
Source: Adapted from industry standards.
Interpreting the Gap between Cpk and Ppk:
The relationship between Cpk and Ppk provides a powerful diagnostic clue about your process stability.
- If Cpk ≈ Ppk, it indicates your process is stable and in statistical control. The short-term variation is a good predictor of the long-term variation.
- If Cpk > Ppk, it indicates the presence of special cause variation or process instability over time (drifts, shifts). Your process has the potential to perform well (high Cpk), but something is causing it to be inconsistent in the long run (lower Ppk). As an Industrial Engineer, this gap is your signal to investigate and eliminate those sources of long-term variation.
The following video translates these numerical values into tangible defect rates, which is extremely useful when communicating project results.
PROCESS CAPABILITY: Explaining Cp, Cpk, Pp, Ppk and HOW TO INTERPRET THOSE RESULTS
This segment from CQE Academy connects Cpk values to sigma levels, conformance percentages, and Defects Per Million (DPM).
Watch the segment from 11:46 to 15:36. Pay close attention to the table that translates Cpk values (0.33, 0.67, 1.0, etc.) into defect rates. This is the language you will use to explain the business impact of improving process capability.
4. Reading a Capability Report
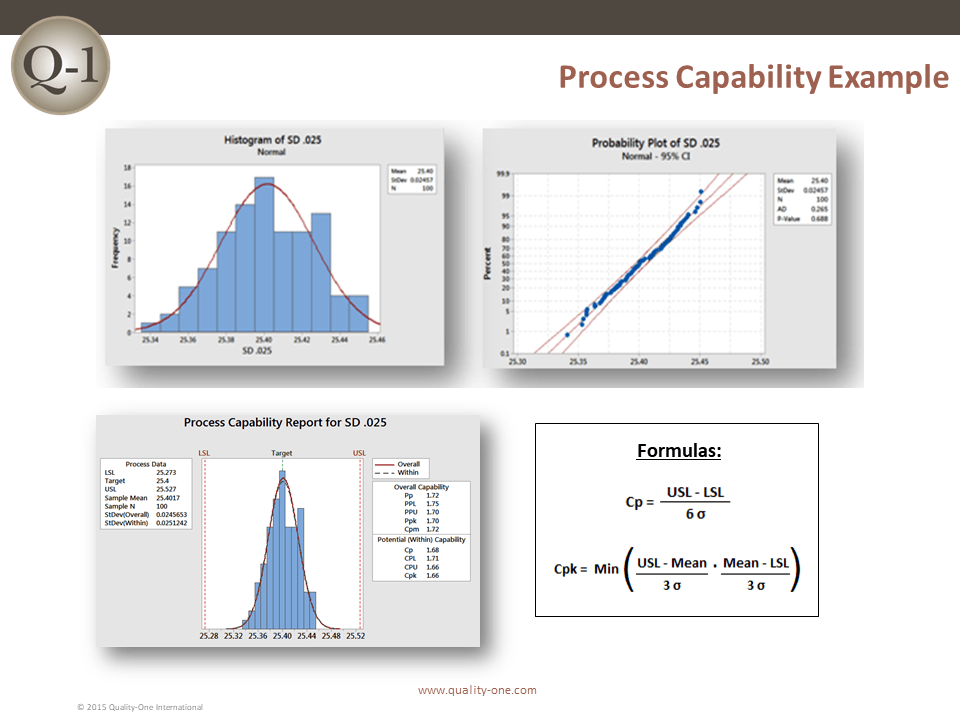
In practice, you will use statistical software like Minitab to perform these calculations. The output is a comprehensive report that you need to be able to interpret.
Conclusion
You have now formalized your understanding of the essential metrics for quantifying process capability. You are equipped to move beyond a simple "good/bad" assessment and can now precisely measure, interpret, and communicate the performance of a manufacturing process.
Key Takeaways:
- Process capability compares the "Voice of the Process" (variation) to the "Voice of the Customer" (specifications).
- Cp measures potential capability (spread only), while Cpk measures actual capability by accounting for process centering.
- Cpk uses short-term () variation and reflects what a process can do when stable.
- Ppk uses long-term () variation and reflects what a process is actually doing, including all shifts and drifts.
- A Cpk/Ppk value greater than 1.33 is a common benchmark for a capable process.
- The gap between Cpk and Ppk is a key indicator of process instability and an opportunity for improvement.
Preview of the Next Lesson:
In this lesson, you saw how capability reports often include a "PPM" or "Parts Per Million" defective value. This is a direct measure of process performance. In our next lesson, we will focus on this concept, learning to Calculate Defects Per Million Opportunities (DPMO) and convert to a Sigma level. This will allow you to describe any process's quality level on the universal Six Sigma scale.