Introduction
Welcome to the fourth module of our course. In the previous module, we focused on the Measure phase of DMAIC, learning how to quantify process performance through capability analysis (Cp/Cpk), DPMO, and Sigma Levels. You now have a solid toolkit for establishing a process baseline and describing the magnitude of a problem in standardized Six Sigma terms.
Now, we transition to the Analyze phase. Our goal is no longer just to measure the problem, but to uncover its root causes. This module is dedicated to the tools that help us move from a list of potential causes to confirmed, data-driven drivers of variation.
This lesson specifically addresses the learning outcome: Prioritize potential causes using a Cause & Effect Matrix linked to CTQs.
You mentioned that you regularly use tools like Fishbone diagrams and the "5 Whys" for root cause analysis. These are excellent for brainstorming and generating a wide range of potential causes. The Cause & Effect Matrix is the logical next step: it provides a structured, semi-quantitative method to sift through that long list and identify the vital few 'X's that have the biggest impact on your critical outputs, or 'Y's. This ensures your analysis efforts are focused where they will have the most impact.
1. What is a Cause & Effect Matrix?
A Cause & Effect (C&E) Matrix is a tool used in the Analyze phase to prioritize potential causes (process inputs, or X's) based on their perceived impact on key process outputs (Y's). These outputs are your project's Critical-to-Quality characteristics (CTQs). It's also commonly known as an X-Y Matrix.
The primary purpose of the C&E Matrix is to bridge the gap between brainstorming and data analysis. After you've generated a comprehensive list of potential causes, the matrix helps your team to:
- Narrow down the list to a manageable number of high-priority variables.
- Objectively evaluate the relationships between inputs and outputs.
- Document the team's collective expertise and assumptions before diving into data collection and hypothesis testing.

2. How to Build a Cause & Effect Matrix
Building a C&E Matrix is a systematic process. The following article from Six Sigma DSI provides an excellent step-by-step guide. We will walk through these steps together.
How to Complete the Six Sigma Cause and Effect Matrix
Please read the following article 'How to Complete the Six Sigma Cause and Effect Matrix' from sixsigmadsi.com. It provides a clear, practical walkthrough of the entire process, from listing your outputs to prioritizing your inputs.
Read the entire article. Pay close attention to each step of the process. In particular, notice the scoring scale used for correlations (0, 1, 3, 9) and the justification for not using a 1-10 scale.
Let's summarize and reinforce the key steps from the article:
Step 1: List the Outputs (Y's)
- These are the customer-facing outputs or effects of your process that you are trying to improve. They should be directly taken from your work in the Define phase (e.g., from your CTQ Tree).
- List these Y's across the top row of your matrix.
Step 2: Rate the Importance of each Output
- Assign a weight to each Y based on its importance to the customer. A scale of 1 to 10 is typically used, where 10 is critically important. This ensures that inputs affecting more critical outputs are given a higher priority.
Step 3: List all Potential Inputs (X's)
- Down the first column of the matrix, list all the potential causes or process inputs your team has brainstormed. These can come from a Fishbone diagram, a process map, or team knowledge. It's often helpful to group them by the process step they belong to.
Step 4: Score the Correlation
- This is the core of the exercise. For each cell where an input (X) and an output (Y) intersect, rate the strength of the relationship.
- Use the recommended non-linear scale:
- 9 = Strong Correlation
- 3 = Moderate Correlation
- 1 = Weak Correlation
- 0 = No Correlation
- As the article notes, this scale is deliberately designed to force a consensus and avoid "fence-sitting" with middle-of-the-road scores.
Step 5: Calculate and Prioritize
- For each input row (each X), calculate a total score. The score is the sum of (Correlation Score × Output Importance Rating) for all outputs.
- Once all scores are calculated, sort the inputs in descending order based on their total score. The inputs at the top of the list are your Key Process Input Variables (KPIVs)—the ones you will carry forward for further analysis.
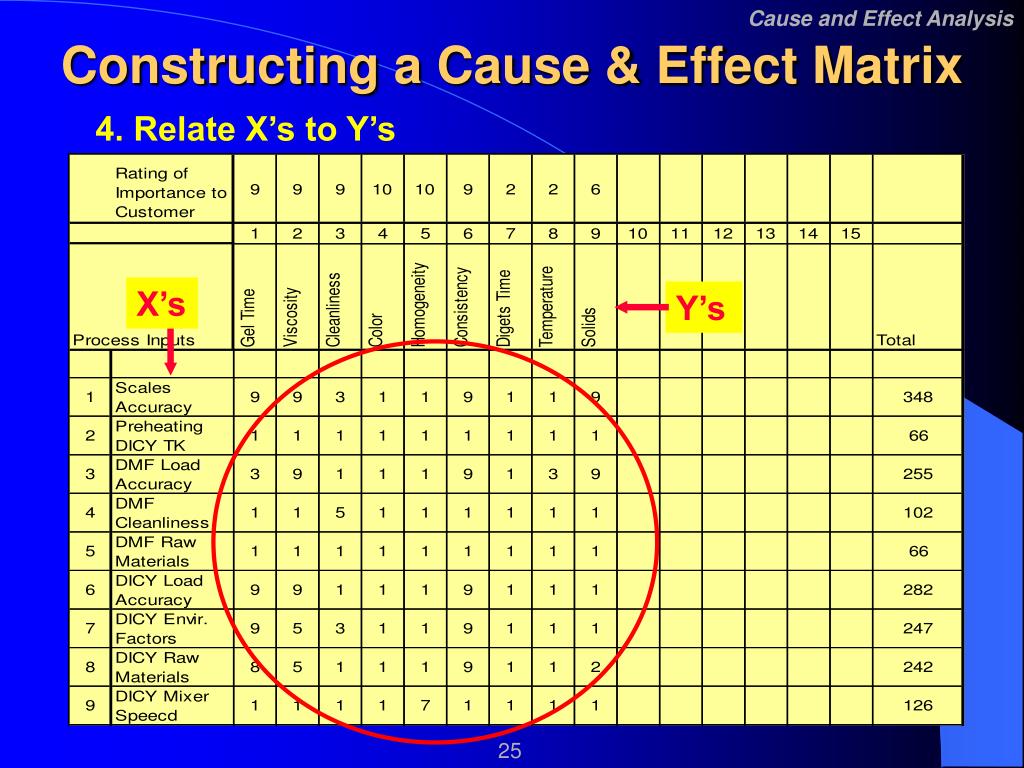
The image below shows a completed C&E Matrix for a chemical manufacturing process. Notice the multiple outputs with different importance ratings, the list of process inputs, and the final prioritized scores on the right.
3. Case Study: Prioritizing Causes for Electrical Defects
Let's look at how this is applied in a real manufacturing project. The following research paper describes a Six Sigma project aimed at reducing electrical failures in a product. After brainstorming, the team used a C&E Matrix to focus their efforts.
[PDF] Implementation of Six Sigma in a Manufacturing Process
Please review this excerpt from the paper 'Implementation of Six Sigma in a Manufacturing Process'. You don't need to read the whole paper, just the section describing the C&E Matrix.
In the 'Phase 3: Analysis' section, locate Figure 2, the 'Cause-Effect Matrix'. Examine the matrix and the text that follows it to see how the team identified their potential causes and which ones they prioritized for investigation.
In this case study, the team identified that "Waste of Aluminum Oxide" was a major contributor to electrical faults. Their C&E Matrix (Figure 2 in the paper) helped them prioritize the inputs that might be causing this waste.
- Output (Y): Electrical Defects (Implicitly given the highest importance, likely a 10).
- Inputs (X's): Wash cycles, Procoat layer thickness, Lots circuit, Grit blast parameters, etc.
- Prioritization: The matrix scores led them to identify the most important causes to investigate: "the quantity of wash cycles, the thickness of the Procoat layer, ... and the parameters of grit blast equipment."
This is a perfect example of the tool in action: it took a broad problem and focused the team's subsequent analysis on a few specific, high-impact variables.
4. Practice Exercise
Now, let's put this into practice. Imagine you are leading a project to improve the quality of custom-machined steel shafts.
Scenario:
The project's goal is to reduce customer complaints related to two CTQs:
- Shaft Diameter: Must be within a tight tolerance. (Rated importance: 10)
- Surface Finish: Must be below a certain roughness value. (Rated importance: 6)
Your project team has brainstormed the following potential process inputs (X's) that could be affecting these outputs:
- CNC Machine Spindle Speed
- Coolant Flow Rate
- Cutting Tool Type
- Operator Skill Level
The team has assigned the following correlation scores. Your task is to build the C&E Matrix, calculate the total scores, and identify the top two KPIVs to investigate further.
| Process Input (X) | Shaft Diameter (Y1) Correlation | Surface Finish (Y2) Correlation |
|---|---|---|
| Spindle Speed | 9 | 9 |
| Coolant Flow Rate | 3 | 9 |
| Cutting Tool Type | 9 | 3 |
| Operator Skill Level | 1 | 3 |
Your Task:
- Calculate the total score for each of the four process inputs.
- Based on the scores, which two inputs should be prioritized for the next stage of analysis?
Take a few minutes to perform the calculations before checking the solution.
Click here for the solution
Here is the completed Cause & Effect Matrix:
| Process Input (X) | Shaft Diameter (Y1) Importance: 10 |
Surface Finish (Y2) Importance: 6 |
Total Score | Rank |
|---|---|---|---|---|
| Correlation | Correlation | |||
| Spindle Speed | 9 | 9 | (9 * 10) + (9 * 6) = 90 + 54 = 144 | 1 |
| Coolant Flow Rate | 3 | 9 | (3 * 10) + (9 * 6) = 30 + 54 = 84 | 3 |
| Cutting Tool Type | 9 | 3 | (9 * 10) + (3 * 6) = 90 + 18 = 108 | 2 |
| Operator Skill Level | 1 | 3 | (1 * 10) + (3 * 6) = 10 + 18 = 28 | 4 |
Conclusion:
Based on the C&E Matrix, the two Key Process Input Variables (KPIVs) that should be prioritized for further investigation are:
- Spindle Speed (Score: 144)
- Cutting Tool Type (Score: 108)
These are the variables that the team believes have the most significant impact on the critical-to-quality outputs.
Conclusion
In this lesson, we formalized the process of prioritizing potential root causes. You've seen how the Cause & Effect Matrix provides a vital link between the broad brainstorming of the Define phase and the focused, data-driven investigation of the Analyze phase.
Key Takeaways:
- The C&E Matrix is a structured tool for prioritizing potential causes (X's) based on their impact on critical outputs (Y's).
- It uses a weighted scoring system that considers both the importance of the output to the customer and the strength of the input-output relationship.
- The use of a non-linear correlation scale (0, 1, 3, 9) helps teams make clearer decisions and avoid ambiguity.
- The final output is a ranked list of Key Process Input Variables (KPIVs) that become the primary focus for the next steps of root cause analysis.
Preview of the Next Lesson:
Now that we have identified our KPIVs—the suspected root causes—what's next? Before launching into formal statistical tests, it's always wise to first visualize the data. In our next lesson, we will learn how to use graphical tools (e.g., Box Plots, Multi-Vari Charts) to visually explore process data for shifts and trends. These visual tools can provide powerful initial evidence of a cause-and-effect relationship and help us formulate the right questions for hypothesis testing.