Welcome to the third lesson in our course on auditing Meta ad accounts. In our previous lesson, we mapped out the five core pillars of a comprehensive audit: data integrity, account architecture, audience and targeting, creative, and governance. This gave us a clear blueprint of what to investigate.
Today, we transition from theory to practice. This lesson is about gathering the raw materials for your audit. We will cover how to systematically extract, clean, and structure historical performance data from Ads Manager. By the end of this session, you will have a clean, organized dataset ready for the deep analysis we'll conduct in the upcoming modules. For an experienced marketer like yourself, moving beyond ad-hoc checks in the UI to a structured data file is the first step toward a professional-grade audit.
Defining Your Data "Shopping List"
Before you export anything, you must decide what information you need. A well-defined data pull is focused and purposeful, designed to answer the questions we outlined in the last lesson. Your export should include a mix of dimensions, primary metrics, and diagnostic metrics.
- Dimensions break down your data (e.g., Campaign Name, Ad Set Name, Ad Name, Placement, Day).
- Primary Metrics tell you what is working by measuring bottom-line results (e.g., Amount Spent, Purchases, Cost per Purchase, ROAS).
- Diagnostic Metrics (or "storytelling metrics") help you understand why something is or isn't working (e.g., CPM, CTR, Frequency, Hook Rate).
For a comprehensive audit, you'll need to pull data over a significant period. A 90-day lookback window is a standard starting point, as it's long enough to identify meaningful trends while being recent enough to reflect current platform dynamics.
The following article provides an excellent list of the essential metrics and dimensions to include in your export.
Meta Ads Historical Data Analysis: Complete Guide 2026 | AdStellar
This guide from AdStellar outlines the foundational steps for data extraction. It provides a clear, concise list of essential columns to get started.
Read the section on setting up your data export. Pay close attention to the list under "Essential columns to include," as this will form the core of your data pull.
In-Platform Analysis vs. Full Data Export
You're already familiar with customizing columns and using the "Breakdown" feature within Ads Manager for day-to-day analysis. This is a powerful way to get quick answers.
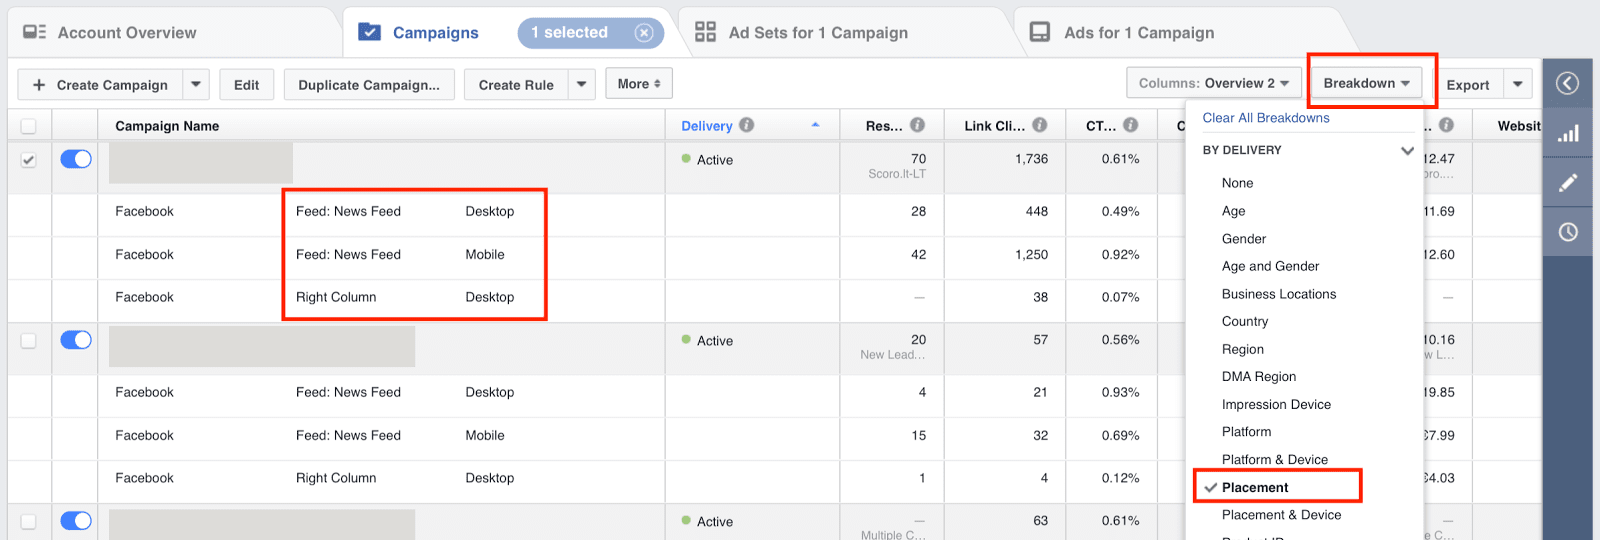
For a deep audit, however, this in-platform view has limitations. It's difficult to analyze long-term trends, create custom calculated metrics that aggregate correctly, or join ad data with external business data (like profit margins or customer lifetime value).
For this reason, the standard for a thorough audit is to export the raw data into a spreadsheet. This gives you the flexibility to clean, segment, and analyze the data in a much more powerful way.
The Export and Organization Workflow
The process of creating your master audit file can be broken down into three phases: Export, Clean, and Structure.
1. Exporting Your Data from Ads Reporting
Meta's Ads Reporting tool is the most robust way to export a large, customized dataset. It allows you to select precise dimensions, metrics, and date ranges.
The following video provides a detailed, step-by-step walkthrough of this entire process, from setting up the report in Ads Manager to building a powerful analysis tool in Excel.
Analyze Facebook Ads Reports in Excel Pivot Tables
This tutorial by Hamid Pasha is a masterclass in turning a raw Meta Ads data export into an actionable pivot table. We will use it as our guide for the next several steps.
First, watch the initial segment from setting up the report. Focus on how he uses filters to select specific campaigns, customizes his columns to include only necessary metrics, and chooses the appropriate date range. Notice his decision to export raw numbers like 'Amount Spent' and 'Results' rather than calculated metrics like 'Cost per Result'—we'll see why this is important shortly.
2. Cleaning Your Raw Data
Once you have your CSV file, the next step is to clean and prepare it for analysis. Raw data exports are often messy and can contain information that will skew your findings if not properly handled.
Always work on a copy of your export, keeping the original raw file untouched. Key cleaning steps include:
- Filtering out test campaigns: Remove any campaigns with names like "TEST" or those with minimal spend that were not part of a structured experiment.
- Standardizing naming conventions: This is a critical step where many analyses fall short. If one campaign uses "Retargeting" and another uses "RTG", your spreadsheet won't be able to group them. Manually clean these up for consistency.
- Removing zero-impression rows: These are ads that were created but never ran, and they add unnecessary noise to your dataset.
The AdStellar article you read earlier provides a good summary of this cleaning process.
Meta Ads Historical Data Analysis: Complete Guide 2026 | AdStellar
Let's revisit the AdStellar article to review the principles of data cleaning.
Read the section on organizing and cleaning. This reinforces the importance of standardizing names and removing irrelevant data before you begin your analysis.
3. Structuring Your Data for Analysis
This is where you transform your clean data into a powerful analytical tool. If your account uses a consistent and descriptive naming convention, you can parse these names into new columns that serve as powerful dimensions for analysis.
For example, a campaign named USA_Prospecting_Q4-Sale_ASC could be broken down into new columns: Geo (USA), Audience (Prospecting), Promotion (Q4-Sale), and Campaign Type (ASC). This allows you to aggregate performance by any of these dimensions.
The Hamid Pasha video demonstrates this technique perfectly using Excel's "Text to Columns" feature.
Analyze Facebook Ads Reports in Excel Pivot Tables
Now, let's watch the practical application of structuring data based on naming conventions.
Watch the segment from the video where he uses "Text to Columns" to separate parts of his campaign, ad set, and ad names into new, analyzable columns like "City," "Audience," and "Creative Name." This is a highly effective method for creating custom dimensions for your pivot tables.
Building Your Analysis with Pivot Tables
With your data cleaned and structured, a pivot table is the fastest way to start uncovering insights. It allows you to dynamically slice and dice your data, aggregating metrics across the dimensions you've created.
A crucial best practice, especially for an experienced analyst, is to create calculated metrics within the pivot table itself, rather than exporting them from Meta.
Analyze Facebook Ads Reports in Excel Pivot Tables
Let's continue with the video to see how to build the pivot table and add calculated fields.
First, watch the section on creating the initial pivot table. Observe how he drags dimensions (like 'City') into the rows and raw metrics (like 'Amount Spend' and 'Results') into the values. Next, watch the most critical part of this lesson from creating calculated fields. He explains why you should calculate metrics like CTR, CVR, and CPL within the pivot table: it ensures that the calculations are accurate at every level of aggregation (e.g., the total CPL for a campaign is calculated from the total spend and total leads, not by averaging the CPLs of its ad sets). This is a fundamental concept for sound data analysis.
Following this process will leave you with a powerful, flexible tool for your audit. You can easily switch between analyzing performance by campaign objective, audience type, creative format, or any other dimension you've established.

Conclusion
In this lesson, you've learned the systematic process for gathering, cleaning, and structuring the data required for a comprehensive Meta Ads audit. Moving beyond the Ads Manager UI and building a dedicated analysis file in a spreadsheet is a hallmark of a professional and rigorous audit process.
Key Takeaways:
- A proper audit requires a full data export to a spreadsheet for deep, flexible analysis.
- The data gathering process involves three phases: Export (using Ads Reporting), Clean (removing noise and standardizing names), and Structure (creating new dimensions from naming conventions).
- Using pivot tables allows for dynamic analysis by slicing data across different dimensions.
- For accurate analysis, it is best practice to create calculated metrics like CTR, CVR, and CPA directly within the pivot table, rather than exporting them from Ads Manager.
You now have the foundational dataset for your audit. In our next and final lesson of this module, we will discuss how to establish brand-specific KPIs and performance benchmarks. This will give us the yardstick against which we can measure all the data we've just organized, allowing us to definitively identify areas of strength and weakness in the account.