Welcome to the final lesson of our first module on building an audit framework. In our previous session, we did the essential groundwork of exporting, cleaning, and structuring your account's historical data into a powerful analysis file. You now have the "what"—a comprehensive dataset describing past performance.
In this lesson, we will establish the "so what?" by defining the yardsticks against which all that data will be measured. Our goal is to establish brand-specific Key Performance Indicators (KPIs) and performance benchmarks. By the end of this session, you will have a clear, multi-layered scorecard that defines what "good" looks like for your specific brand, moving beyond generic industry averages to create a truly meaningful audit framework.
From Metrics to Meaning: Defining Your KPIs
As a performance marketer, you're familiar with the sea of metrics available in Ads Manager. An effective audit, however, doesn't track everything; it focuses on a select few Key Performance Indicators (KPIs) that are directly tied to core business objectives. The rest are diagnostic metrics, which help explain why your KPIs are or aren't being met.
A solid audit starts by defining the KPIs that reflect the overall health and profitability of your marketing efforts.
Issue #136 | The Ultimate Meta Ads Account Audit, Part II
This article by Sam Tomlinson, a seasoned performance marketer, cuts through the noise to identify the metrics that truly matter in a growth-focused audit. It also provides a checklist that grounds these metrics in core business goals.
First, read the section The Metrics That Matter Most. Pay close attention to the distinction between platform metrics like ROAS and business-level metrics like MER and NC-ROAS. Then, review the checklist under the heading Business & Goal Alignment. This reinforces that all KPIs must connect back to documented business objectives, customer value, and operational realities.
As the article highlights, relying solely on platform-reported ROAS can be misleading. For a robust internal audit, your primary KPIs should provide a more holistic view of performance:
- Marketing Efficiency Ratio (MER): Also known as blended ROAS, this is your north-star metric. It's calculated as
Total Revenue / Total Ad Spend. This tells you if the entire business is becoming more or less efficient as ad spend changes, smoothing out attribution complexities. - New-Customer ROAS (NC-ROAS): This is your key growth indicator. For an established brand, distinguishing between revenue from new versus existing customers is critical. A high overall ROAS might be masking an over-reliance on retargeting, which can limit growth. Calculating this requires segmenting your sales data (e.g., using Shopify tags or your CRM).
- Cost Per Acquisition (CPA): The bedrock efficiency metric. What does it cost to acquire a paying customer? This is often the primary lever you can control.
The Three Layers of Benchmarking
Once you've defined your primary KPIs, you need to benchmark them. A single number is meaningless without context. For a comprehensive audit, you'll use three layers of benchmarks.
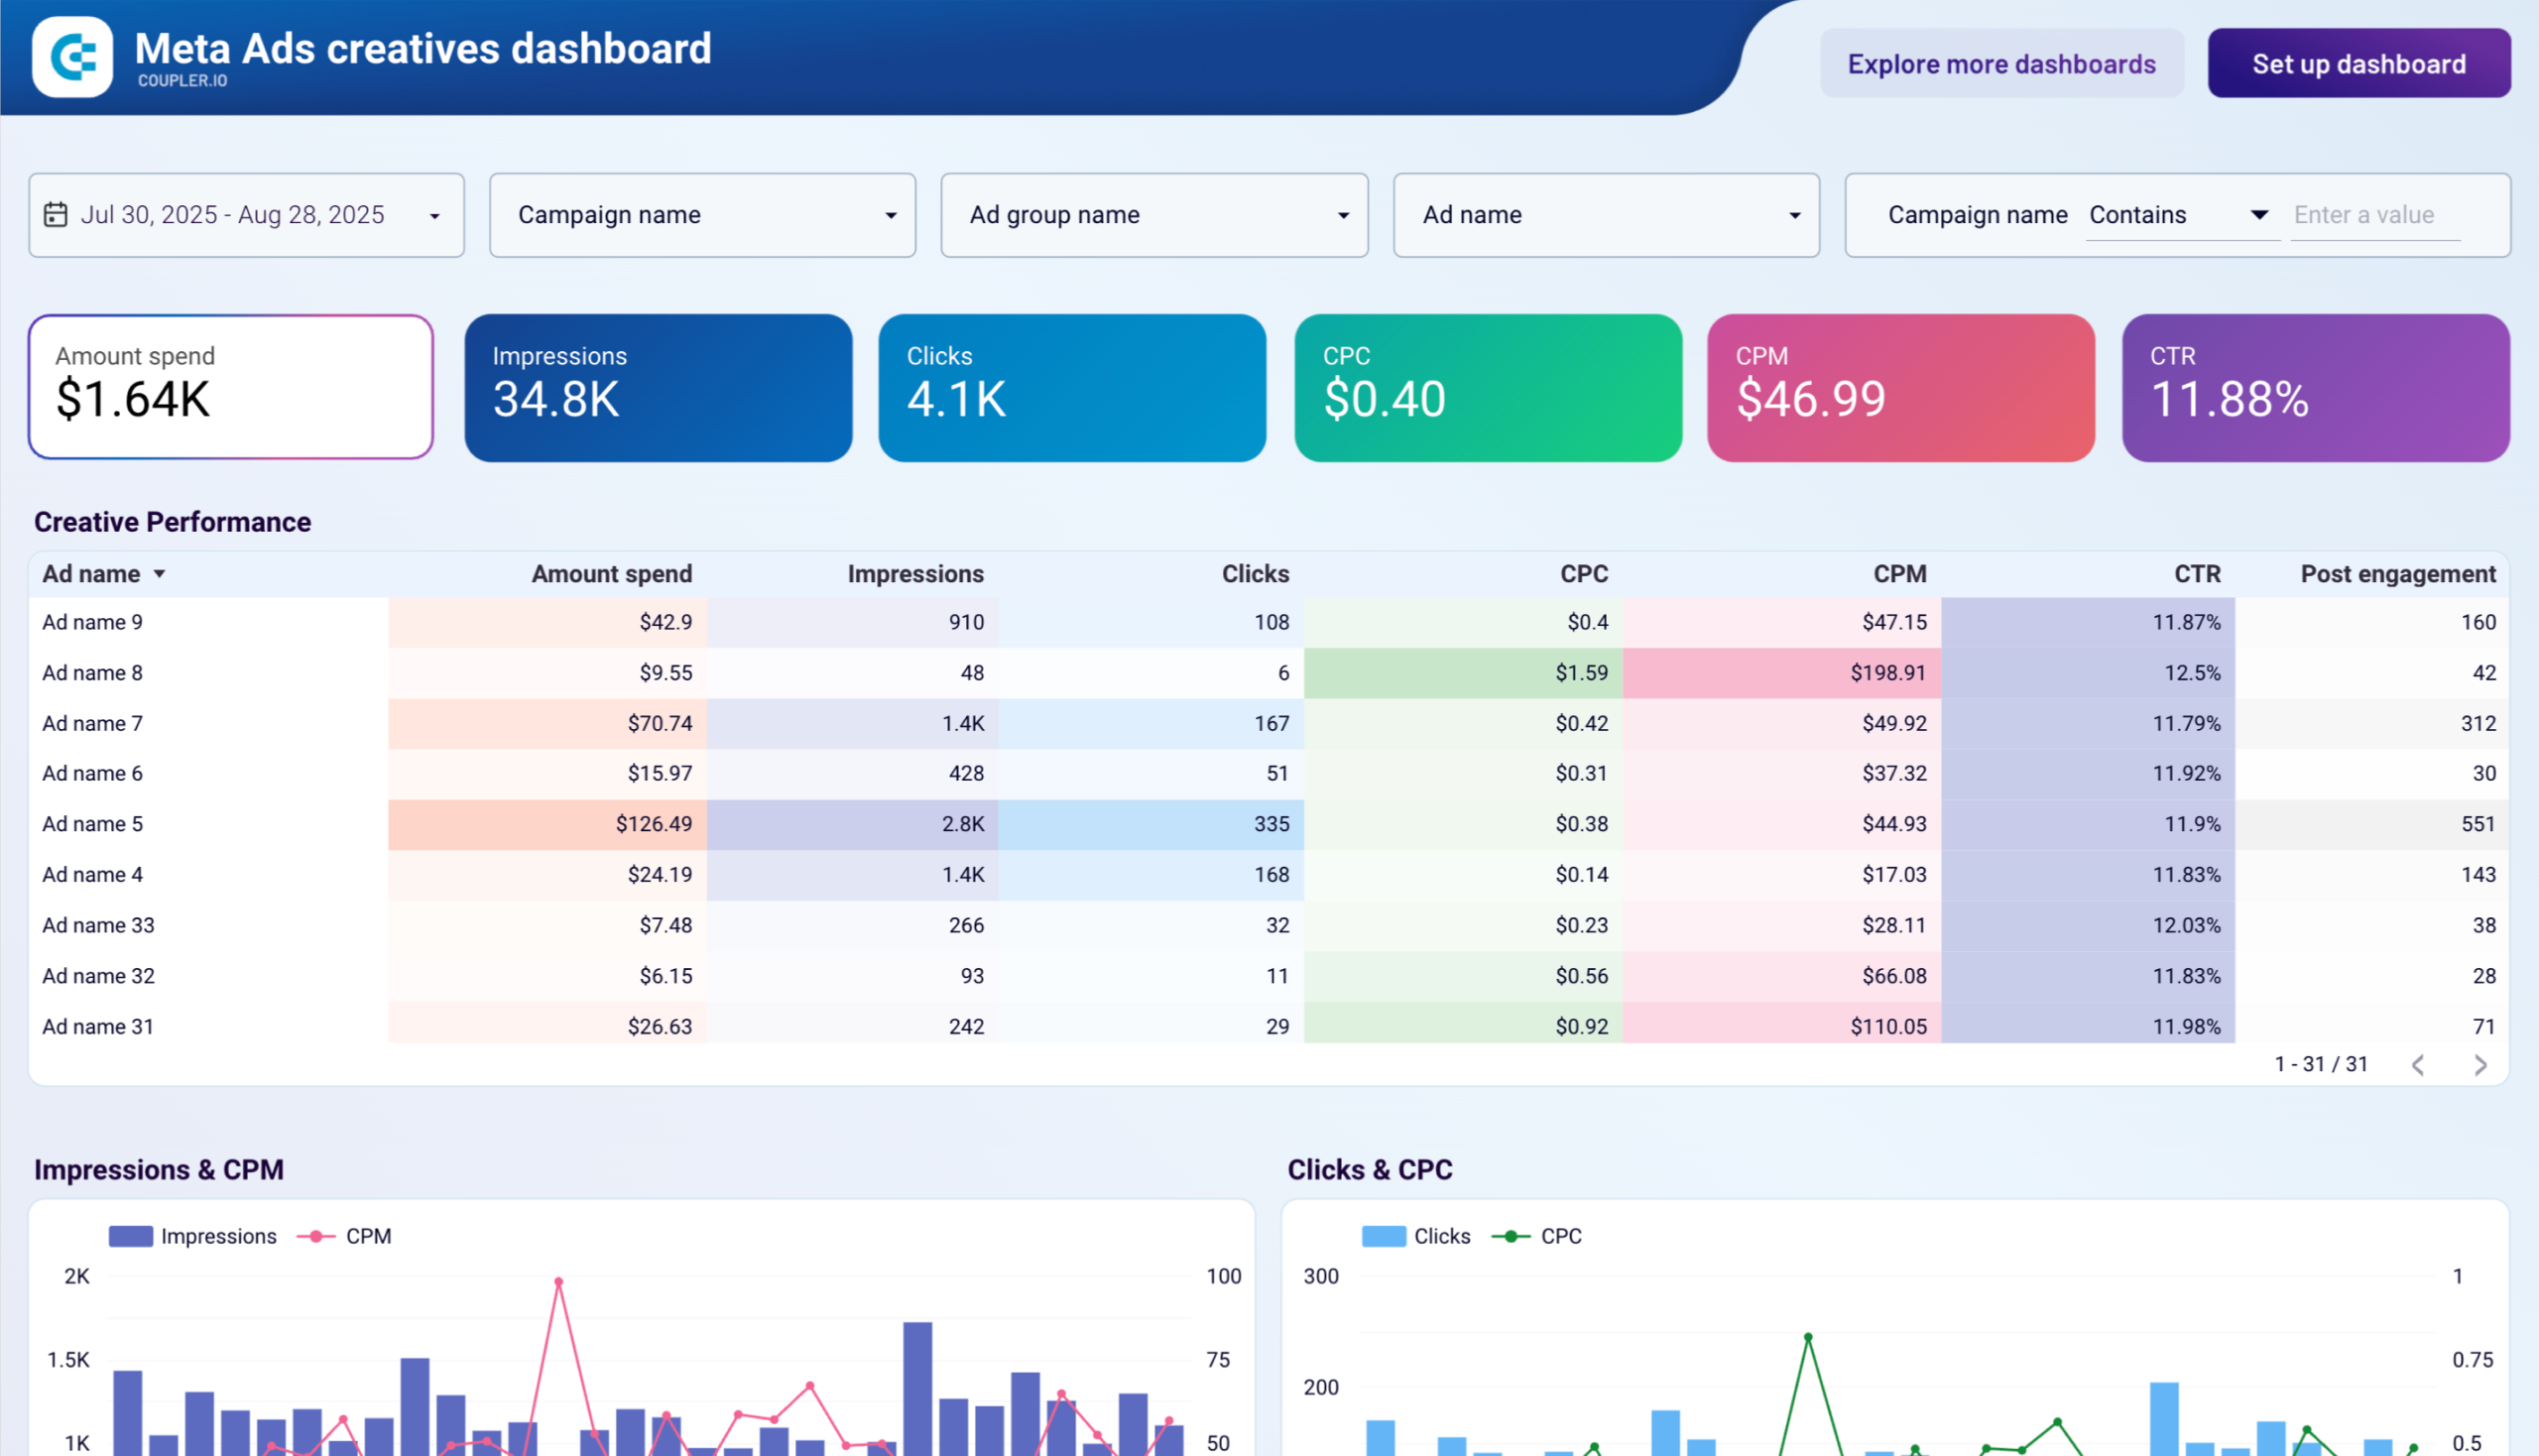
Layer 1: The Business Target (The Profitability Benchmark)
This is the most important benchmark. It isn't found in Ads Manager or an industry report; it's derived from your company's own financial realities. What CPA or MER do you need to achieve to be profitable and fuel growth?
To set this benchmark, you must know your numbers:
- Average Order Value (AOV)
- Cost of Goods Sold (COGS)
- Profit Margin
The following video provides a brilliant, practical walkthrough of how to calculate a breakeven point for a funnel. While the example is for an info-product funnel, the logic is directly applicable to an e-commerce business.
Facebook Ads & Marketing Funnel Performance Revealed - How To Know Your Key Performance Indicators
This video from Miles Beckler demystifies funnel math. He shows exactly how to work backward from your offer's value to determine the maximum you can afford to pay for a lead or, in our case, a click or customer.
Watch from the beginning to understand the concept of a breakeven funnel, which aims to acquire customers at zero net cost. Next, see how he structures his funnel and calculates his Average Order Value (AOV). Then, follow his calculation to determine how many subscribers are needed to get one customer. For e-commerce, this is analogous to your conversion rate (e.g., how many landing page visitors are needed to get one purchase). Finally, watch the key segment where he combines these numbers to calculate his breakeven point per subscriber. This is the maximum he can pay while remaining profitable on the front end.
Let's adapt this logic to calculate your Breakeven CPA:
Breakeven CPA = Average Order Value (AOV) x Gross Profit Margin
For example, if your AOV is $100 and your gross margin is 40%, your breakeven CPA is $40. This means you can spend up to $40 to acquire a customer and you will not lose money on that first purchase. Your Target CPA should then be set below this breakeven point to ensure profitability (e.g., a target of $30 would yield a $10 profit per order).
This business target is the ultimate pass/fail line for your audit.
Layer 2: The Historical Baseline (The Performance Trend)
The most relevant benchmark for your account is its own past performance. Are your campaigns improving or regressing? The data you organized in the last lesson is the source for this layer.
Meta Metrics That Matter for Your Board | Capacity Blog
This article, though aimed at reporting to leadership, provides a sharp perspective on what makes a benchmark meaningful.
Read the sections Focus on Rates, Not Just Totals and Benchmark Against Yourself First. The key insight here is that your own historical rates (like CPA, CVR, ROAS) provide the most powerful context for evaluating current performance.
Using the pivot table you created, calculate the average for your primary KPIs (MER, CPA, ROAS) over the last 90 days. Then, you can break this down further (e.g., month-over-month) to identify trends. This baseline tells you what has been "normal" for your account.
Layer 3: The Industry Standard (The Contextual Benchmark)
Finally, it can be useful to see how your performance stacks up against broader industry averages, especially for diagnostic metrics. However, treat these with caution—they are context, not gospel. Factors like brand maturity, price point, and market saturation cause wide variations.
In the following video, an agency owner audits an e-commerce account and references his own internal benchmarks for key diagnostic metrics.
Watch Me Audit A $300K/Month ECOM Facebook Ad Account *LIVE*
This live audit by Justin Lalonde is a masterclass in applying benchmarks to diagnose a struggling ad account. We will focus on the specific KPIs he uses as his yardsticks.
First, watch from this timestamp to see the custom columns he sets up in Ads Manager. This is a great reference for the key diagnostic metrics to track. Next, focus on the section from where he discusses his benchmarks for Click-Through Rate (CTR). He looks for a CTR (All) of >2% and an Outbound CTR of >1%. He rightly calls these "soft metrics"—they don't matter if ROAS is strong, but they are critical diagnostic tools when performance is poor. Finally, observe how he analyzes the difference in performance between cold and retargeting campaigns. This is a crucial part of benchmarking; you should have different expectations for different audience temperatures. For example, a much higher ROAS and Conversion Rate are expected from retargeting.
Building Your Audit Scorecard
To bring this all together, create a simple table that will serve as your scorecard for the rest of the audit. This makes your analysis objective and structured.
Here is a template you can use:
| KPI Category | Metric | Business Target (Layer 1) | Historical Baseline (Last 90d) (Layer 2) | Industry Context (Layer 3) |
|---|---|---|---|---|
| Business Health | MER | e.g., > 3.0 | Calculate from data | Varies |
| Growth | NC-ROAS | e.g., > 1.5 | Calculate from data | Varies |
| Efficiency | CPA | e.g., < $50 | Calculate from data | Varies |
| Ad Engagement | CTR (Link) | - | Calculate from data | > 1% |
| Website Conv. | CVR (LPV -> Purchase) | - | Calculate from data | 1-3% (e-com avg) |
| Ad Cost | CPM | - | Calculate from data | Varies by geo/audience |
Fill this out with your brand's specific numbers. This scorecard is now the foundation of your audit. As you analyze different parts of the account in the upcoming modules, you will constantly refer back to it to determine if what you're seeing is "good," "bad," or "average."
Conclusion
In this lesson, you've moved from raw data to strategic insight by establishing a clear set of KPIs and multi-layered benchmarks. This critical step transforms an audit from a subjective review into an objective, data-driven analysis.
Key Takeaways:
- Focus on primary, business-level KPIs like MER and NC-ROAS, not just platform metrics.
- The most important benchmark is your business target, derived from your profit margins and AOV (e.g., your breakeven CPA).
- Your own historical performance is the most relevant baseline for identifying performance trends.
- Industry benchmarks for diagnostic metrics like CTR provide useful context but are not absolute rules.
- Creating a benchmark scorecard provides a clear, objective standard to measure all future audit findings against.
This completes our foundational module on audit preparation. You've defined your scope, organized your data, and now, you've set your standards for success.
In our next module, we will begin the audit proper by diving into "Tracking & Measurement Integrity." Before we can trust any of the numbers in our scorecard, we must first rigorously verify that the data being sent to Meta—from the Pixel and Conversions API—is accurate, complete, and reliable.